Introduction
The worst time to discover your strategy's flaws is when real money is on the line. Yet most traders deploy algorithms based on hope rather than evidence, skipping the one validation step that separates profitable systems from expensive lessons.
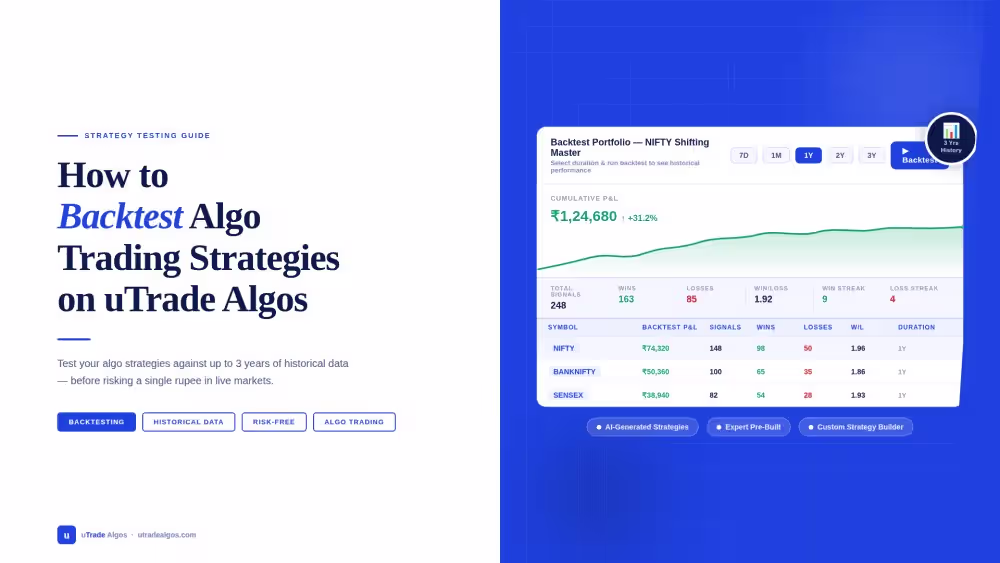
Backtesting algo trading strategies reveals how your algorithm would have performed using historical data, exposing weaknesses before they cost you capital. uTrade Algos makes algo backtesting accessible to everyone—no coding, no complex software, just click and analyze.
Whether you're testing option strategies or equity strategies, the process remains identical, providing consistent validation across all asset classes. This tutorial shows you exactly how to backtest a trading strategy across any timeframe, interpret results accurately, and make data-driven deployment decisions for both options and equities.
Step-by-Step: Backtesting Your Strategy
Step 1: Login and Select Your Strategy
Begin by logging into your uTrade Algos account. You have three strategy options for backtesting:

AI-Generated Strategies: Create algorithms using AI Strategy Builder by describing your trading idea in natural language. The AI generates complete strategy logic instantly, ready for backtesting without any coding.
Suggested Reading: How to Deploy Your First AI Algo with uTrade AI Strategy Builder?

Expert-Built Strategies: Browse Portfolio > Originals for pre-built, exchange-approved strategies. These professional algorithms cover momentum, scalping, options selling, breakouts, and more. Each comes with preliminary backtest results, but you can run custom tests across different periods.
Suggested Reading: How to Build Form-Based Algos via uTrade Strategy Builder
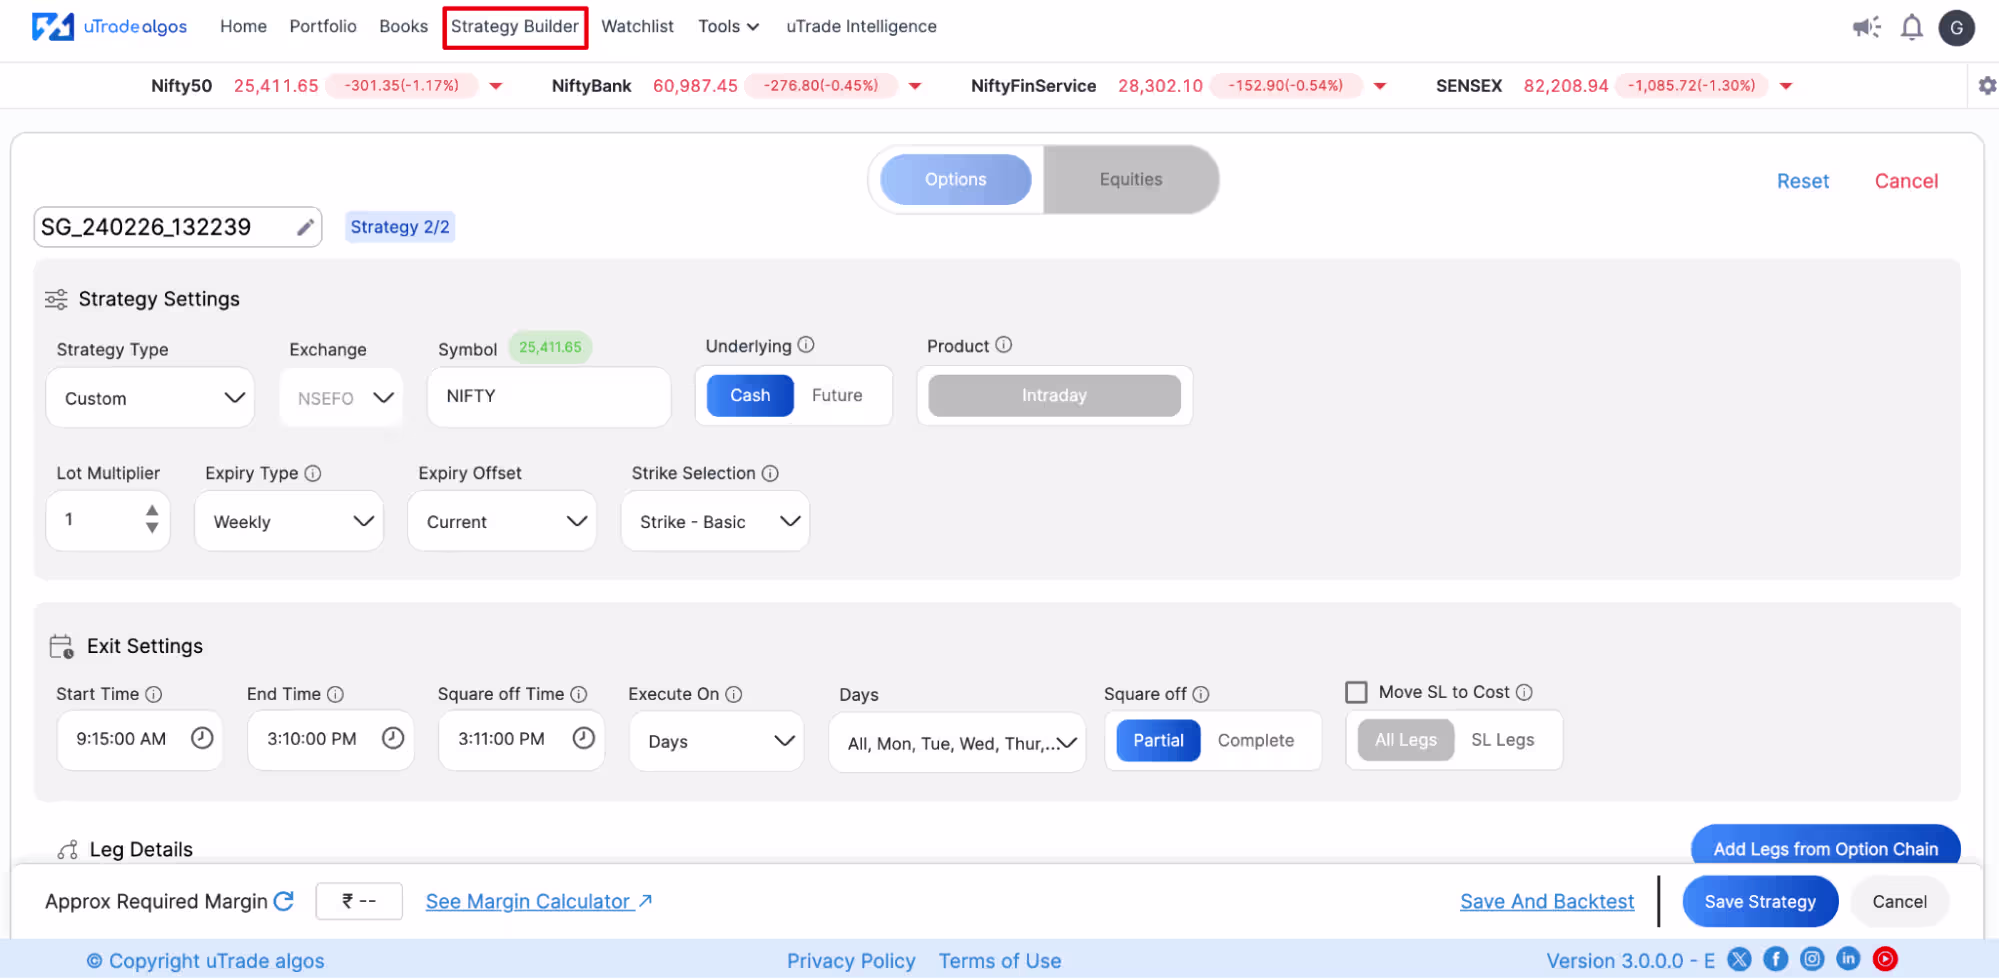
Custom Form-Based Strategies: Build your own using Strategy Builder's intuitive forms. Define entry logic, exit parameters, risk controls, and position sizing through dropdowns and inputs—no programming required.
Navigate to the strategy you want to test. For AI-generated strategies, you'll see them after creation. For expert-built strategies, go to Portfolio > Originals. For custom strategies, visit Portfolio > Created.
Step 2: Click the Backtest Button
The location of the Backtest button depends on which strategy type you're testing:
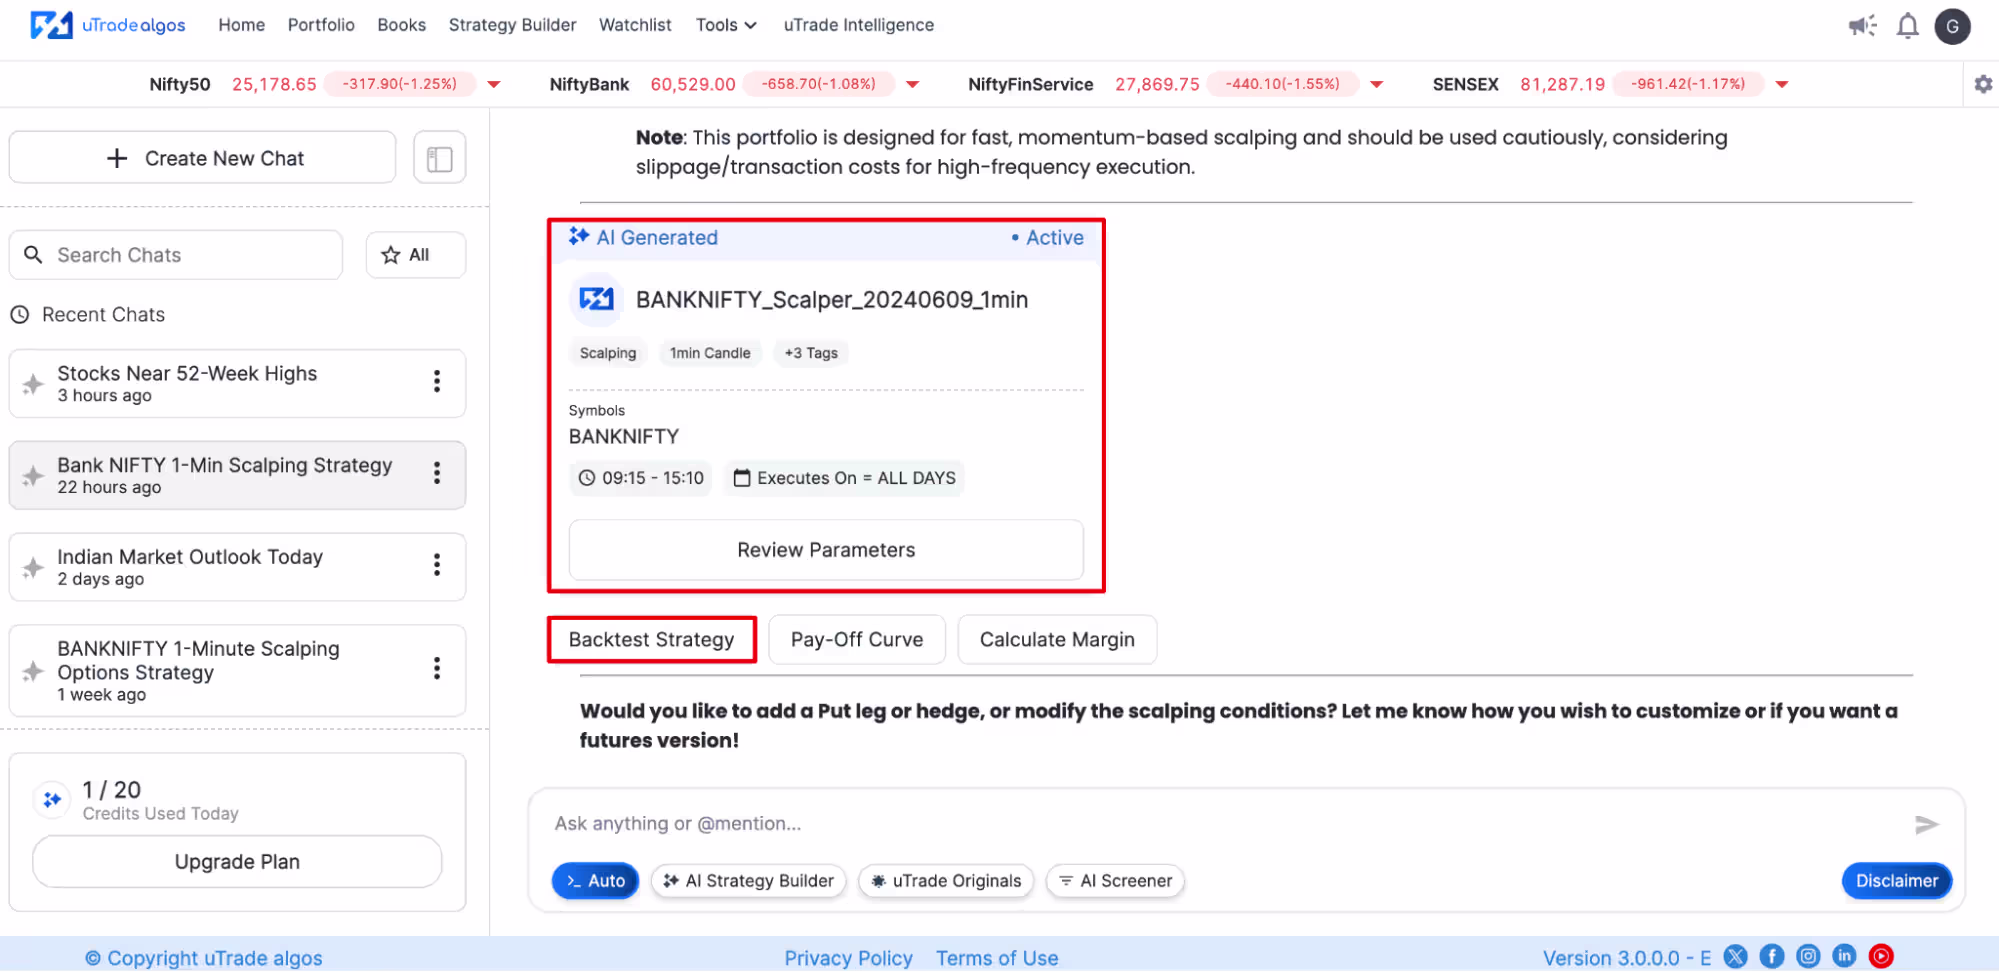
For AI-Generated Strategies: Look below the strategy card immediately after the AI creates your algorithm. A Backtest Strategy button appears prominently, allowing immediate historical validation of the generated logic.
For Expert-Built (Originals) Strategies: You'll find the Backtest option in two locations:
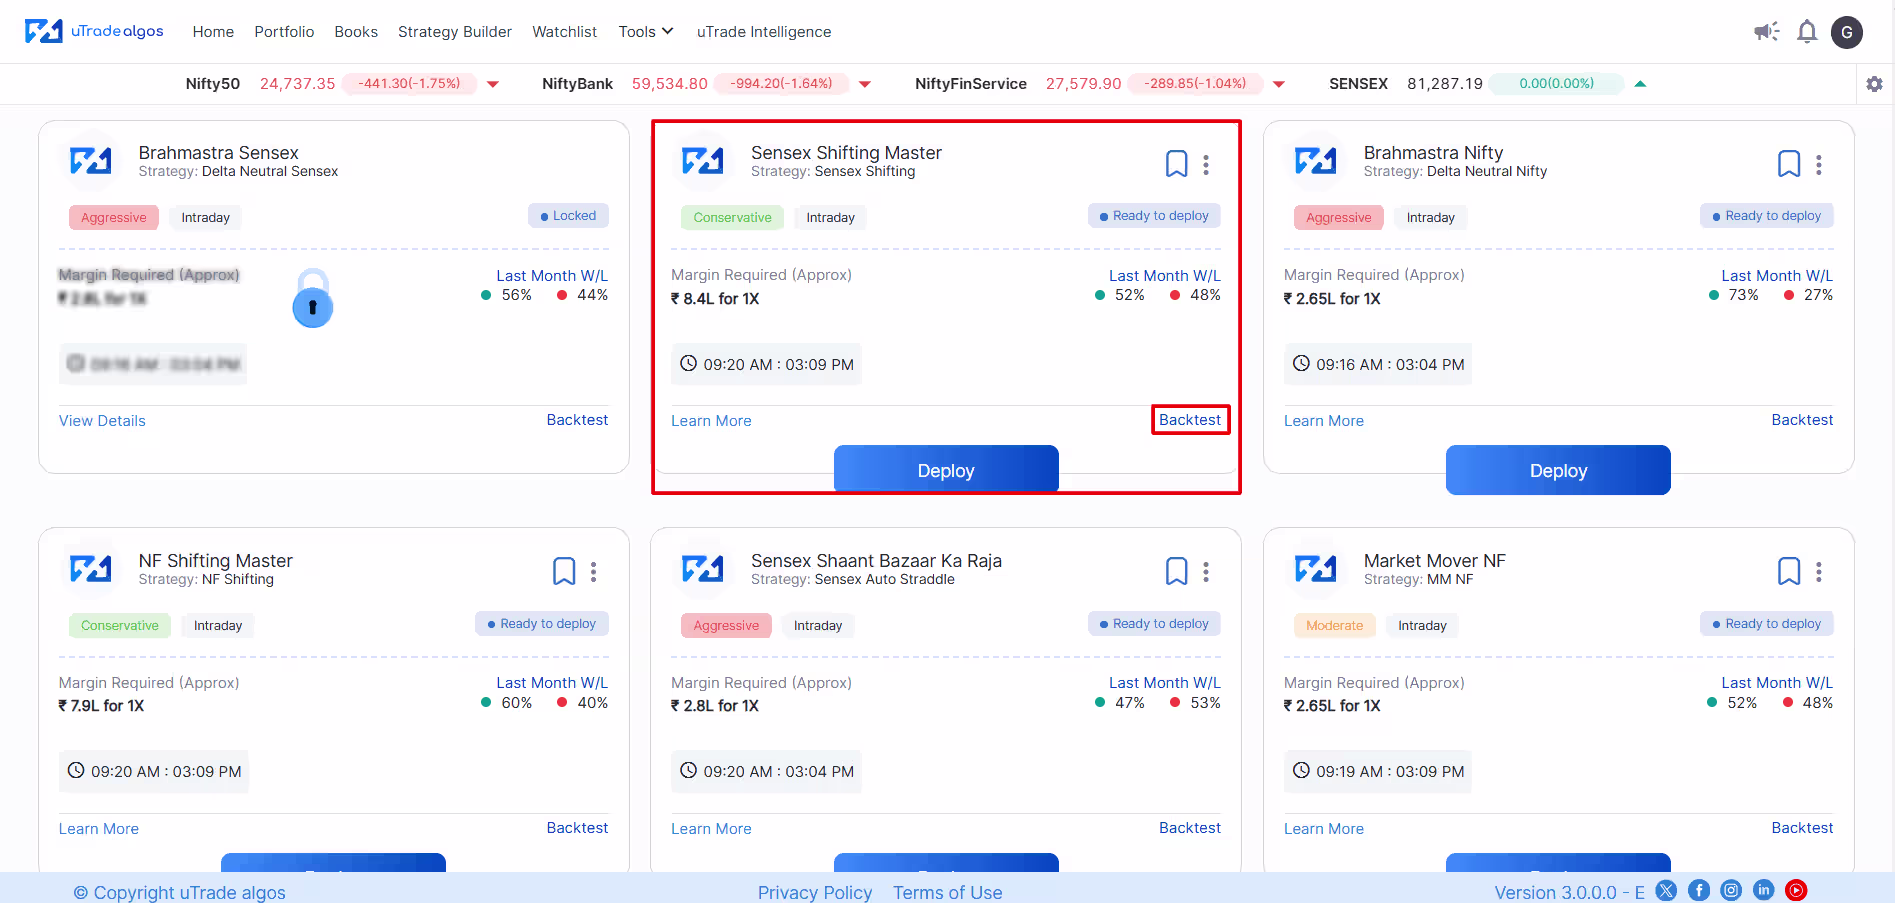
- On the strategy card itself in the Portfolio > Originals grid view, typically in the bottom-right corner.
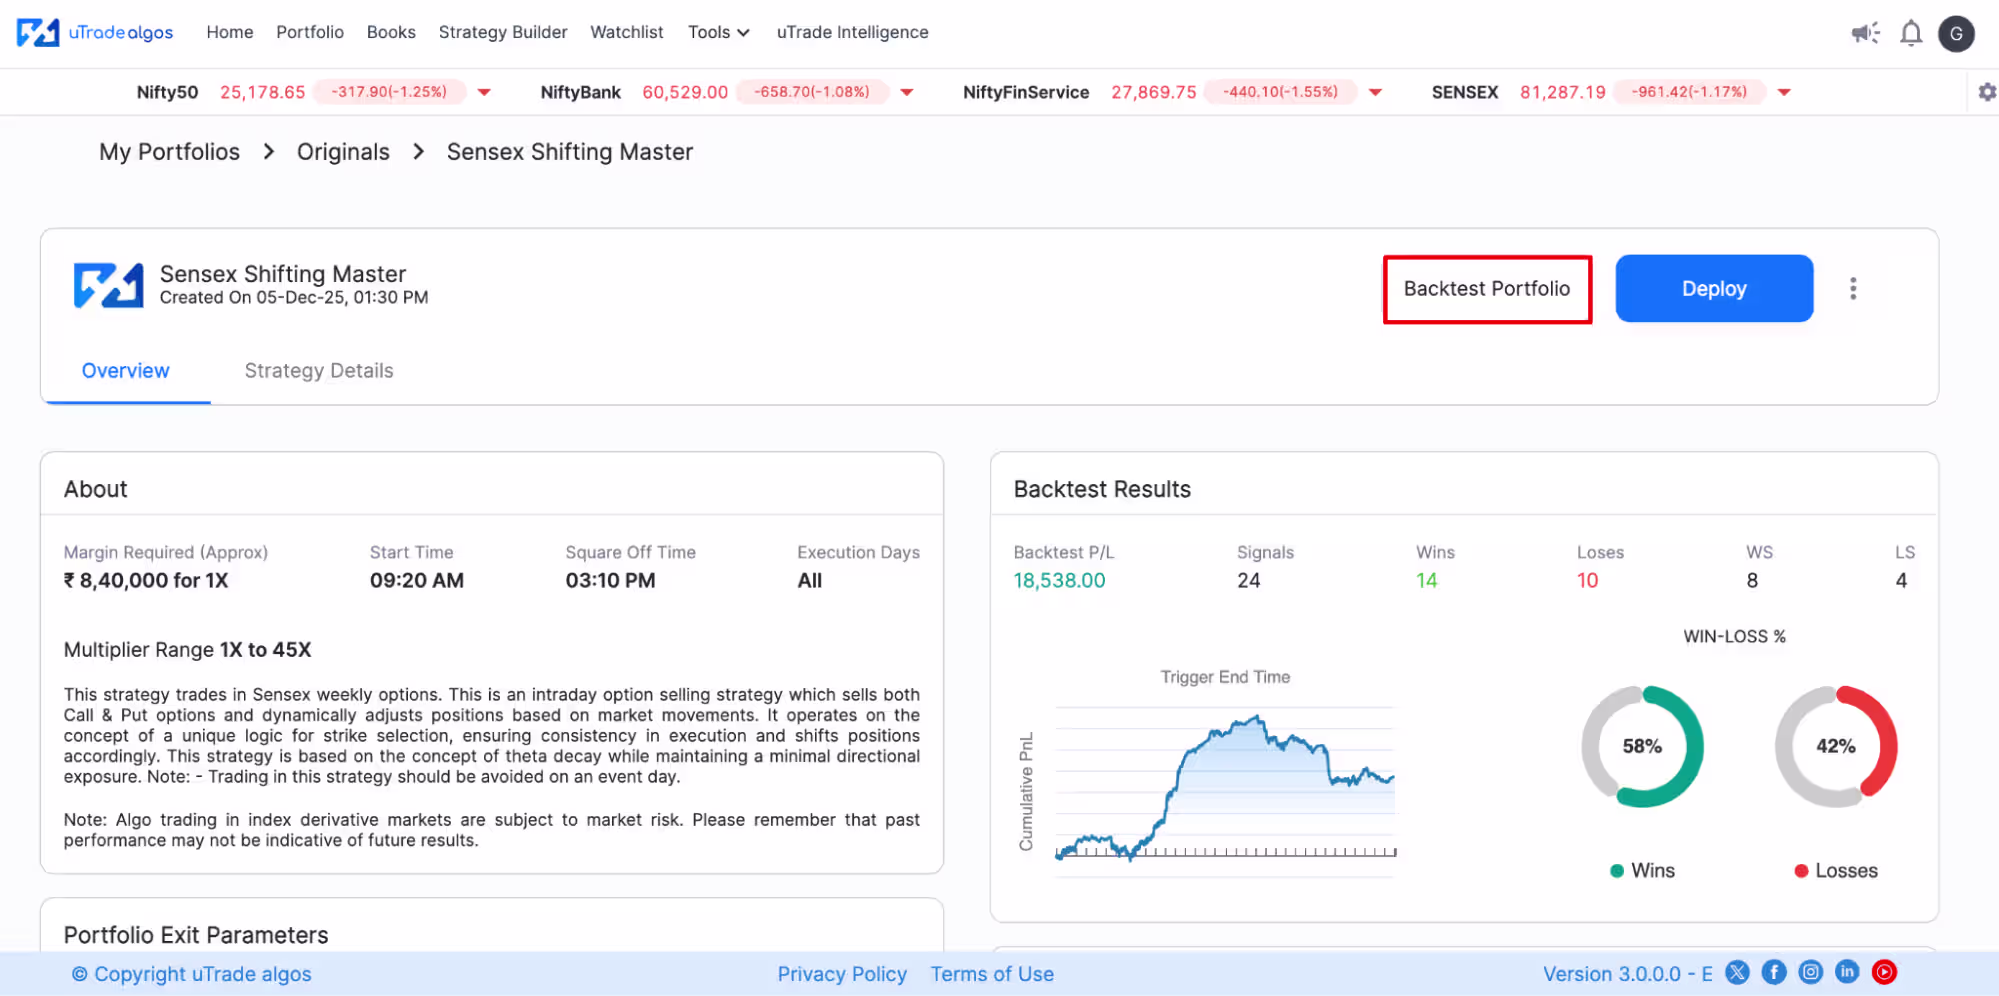
- On the detailed strategy page, after clicking "Learn More," a Backtest Portfolio button appears at the top-right of the screen
For Custom Strategies: Navigate to Portfolio > Created, locate your custom-built strategy card, and click either:
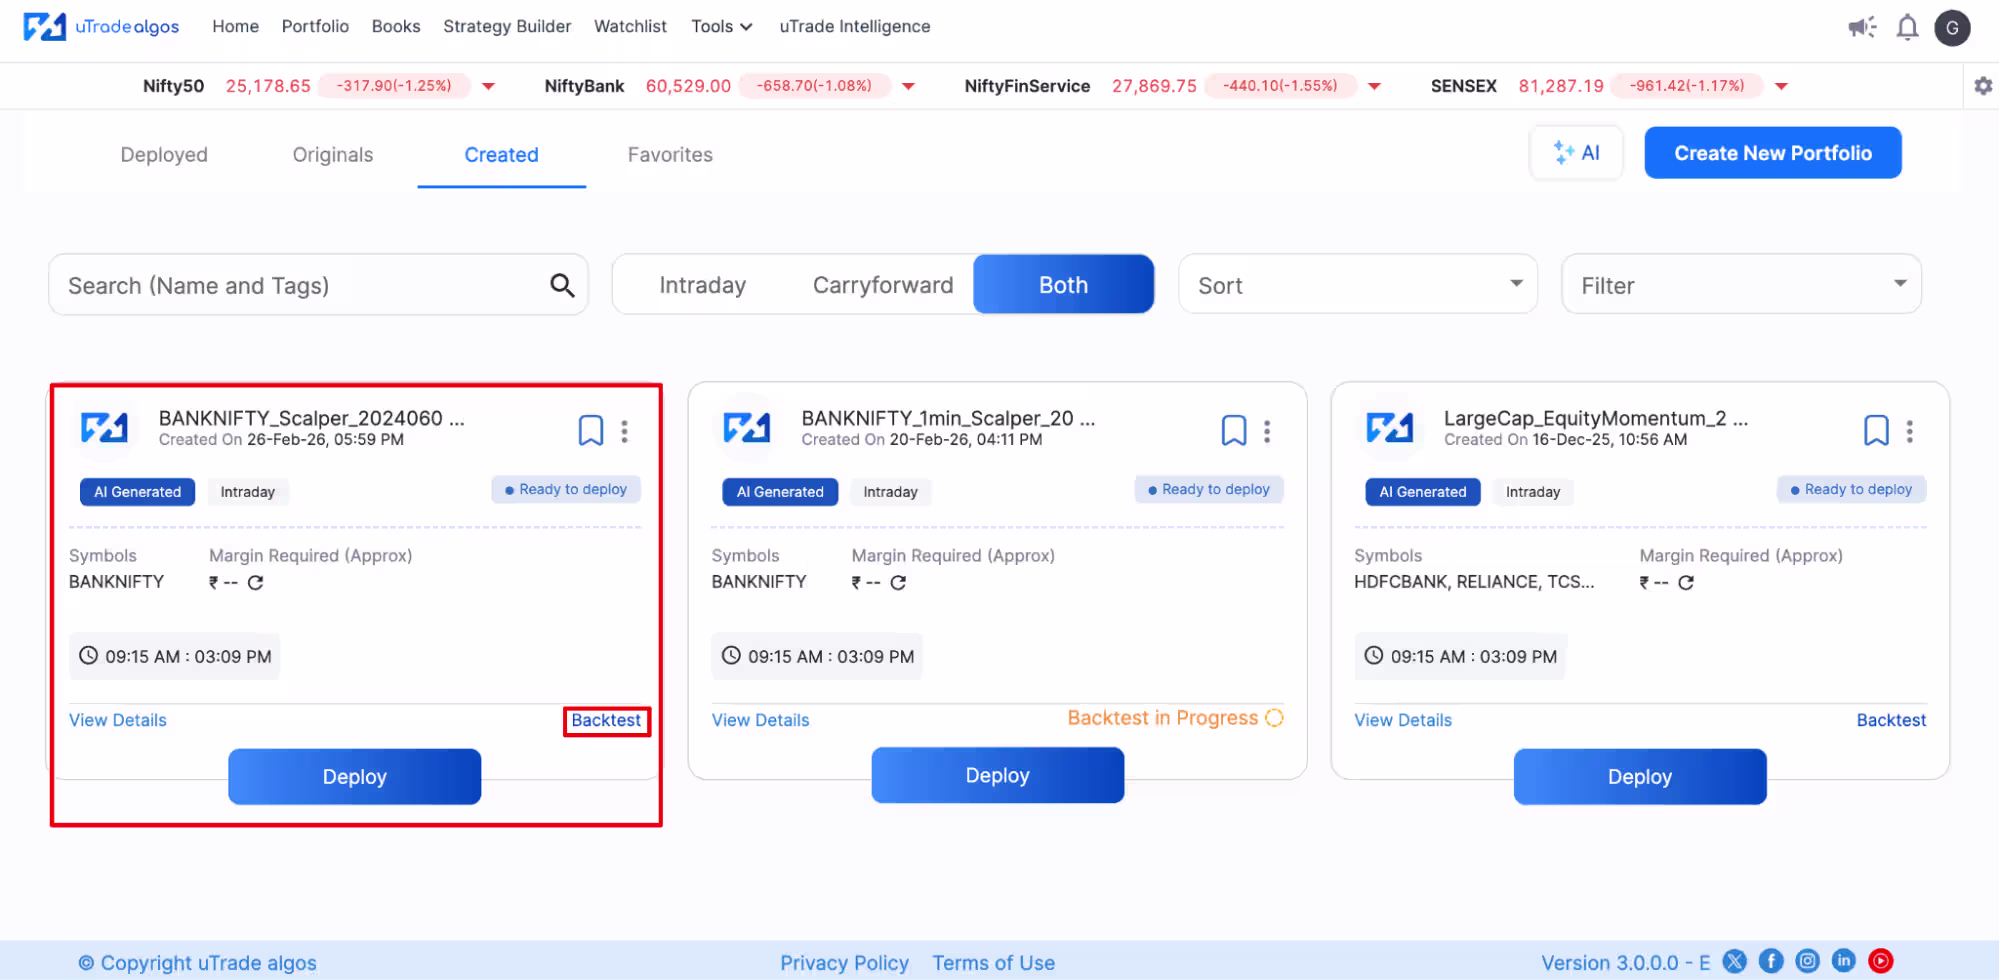
- The Backtest button on the card itself
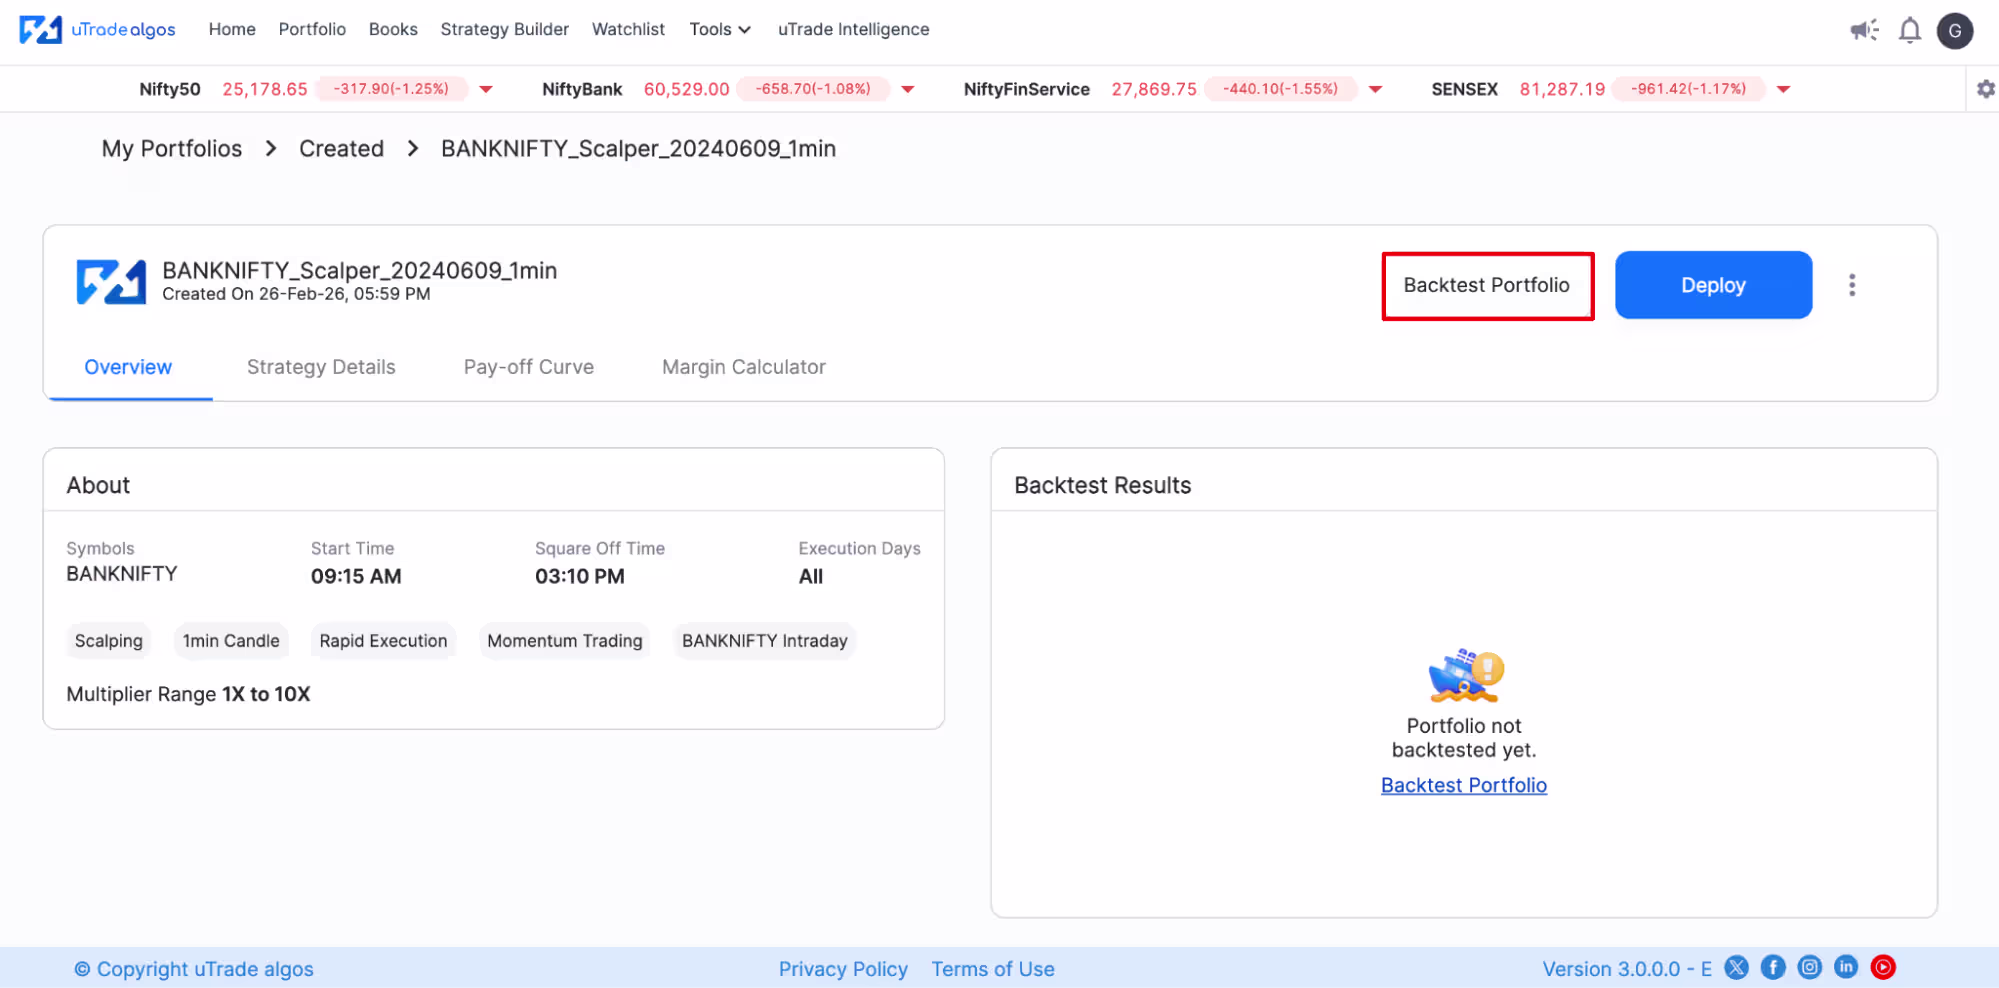
- View Details to open the strategy page, then click Backtest Portfolio at the top-right corner of the screen.
Clicking this button opens the backtesting configuration screen, where you define testing parameters.
Step 3: Configure Backtesting Duration
The backtesting screen displays duration selection options. You have two ways to specify the testing period:
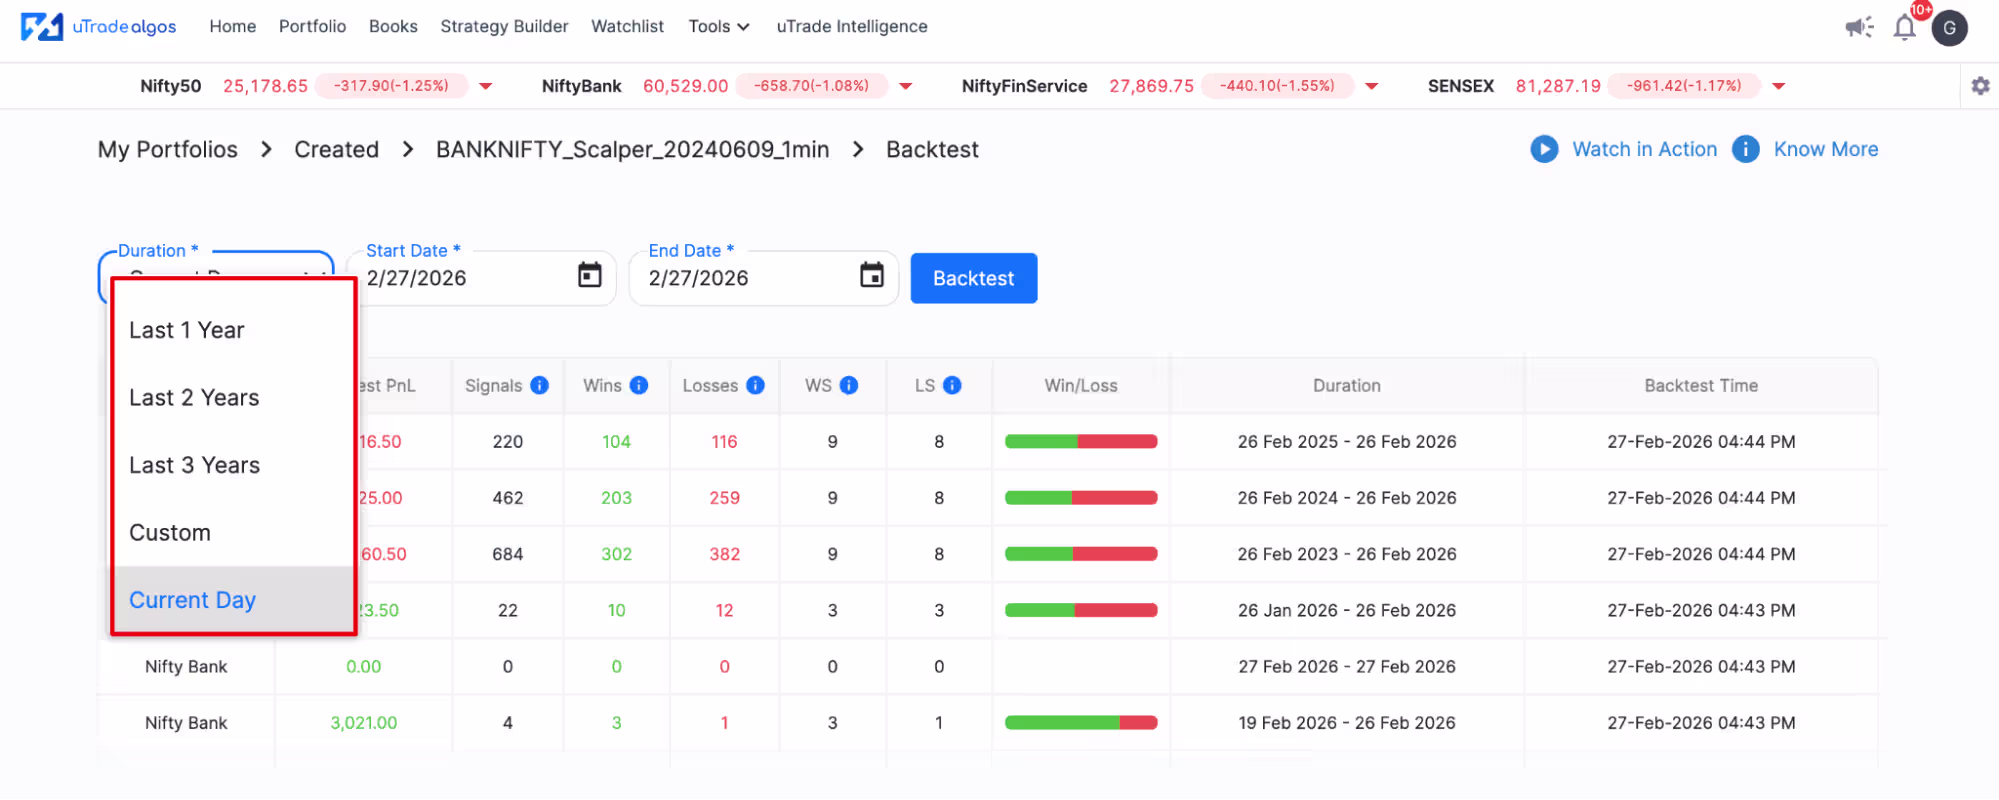
Preset Durations (Dropdown Menu):
- Last 7 Days: Quick test for recent market behavior
- Last 1 Month: Short-term validation across varied sessions
- Last 1 Year: Medium-term testing across seasonal changes
- Last 2 Years: Long-term validation, including different market regimes
- Last 3 Years: Comprehensive testing across extended periods
- Current Day: Validation for the current day
Select the preset that matches your testing goals. Longer periods provide more trade samples and diverse market conditions.
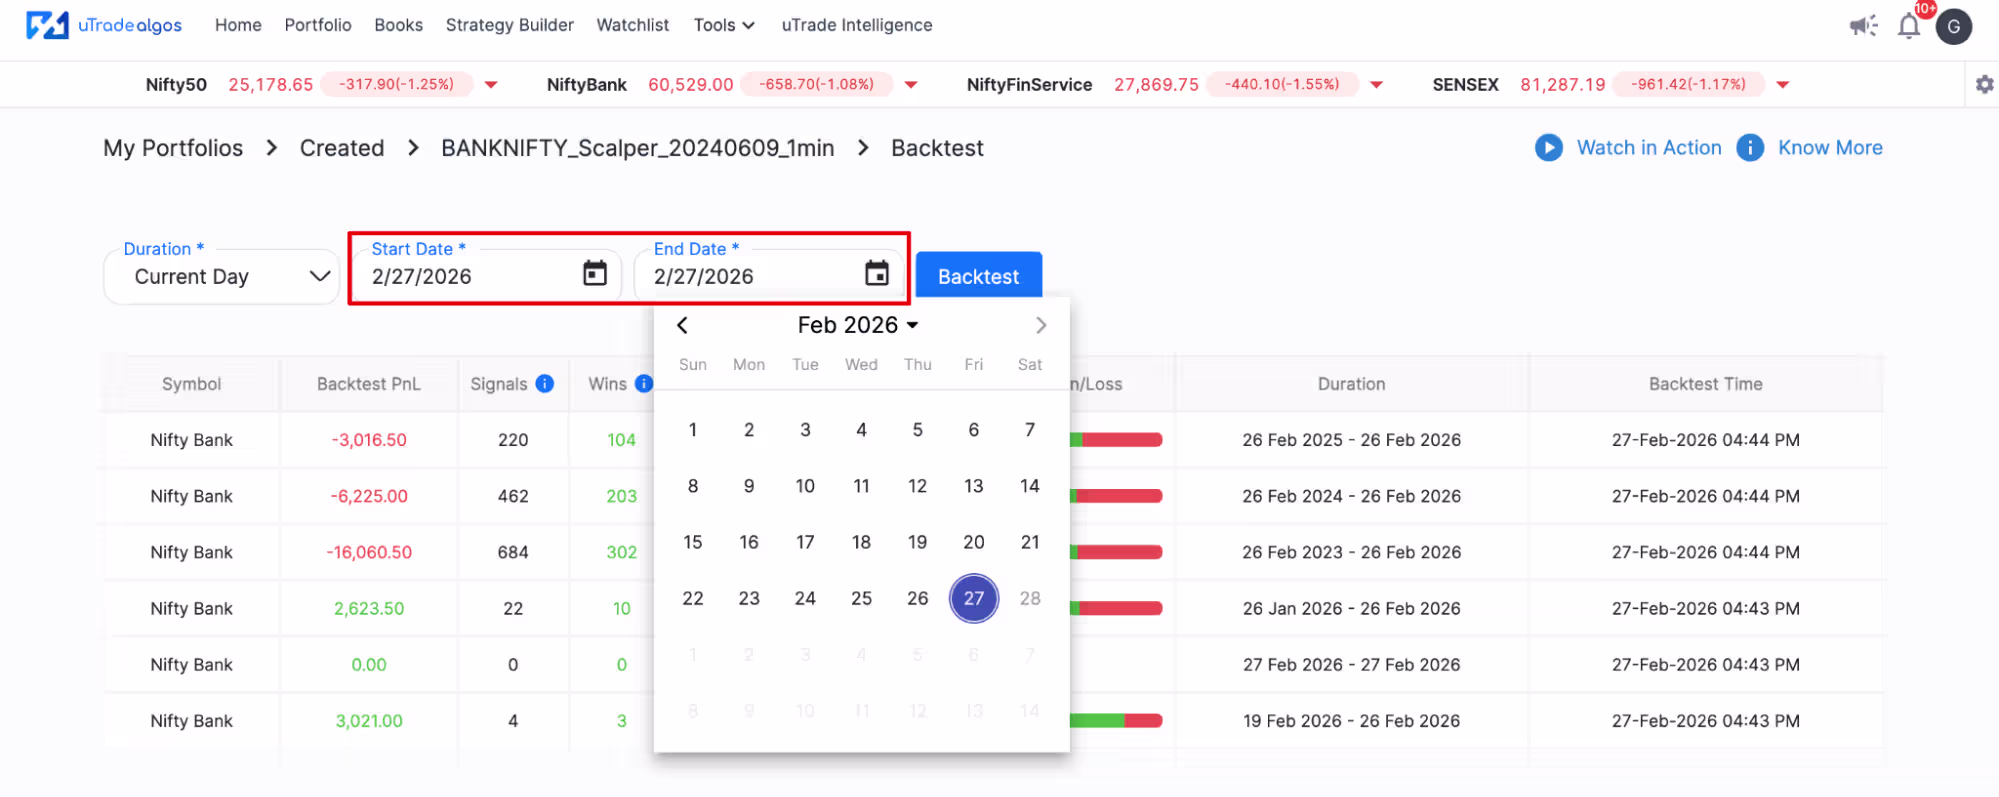
Custom Date Range: For precise control, select custom dates:
- Click the Start Date field and choose when testing should begin
- Click the End Date field and specify when testing should end
- The platform calculates the duration automatically
Custom ranges help you test specific scenarios:
- Only bull market periods
- Only bear market corrections
- Specific volatility events (like 2020 pandemic crash)
- Recent months to validate current market relevance
Choose durations that provide sufficient trade samples—at least 20-30 trades—for meaningful statistical analysis. Very short periods might not generate enough data points.
Step 4: Run Backtest
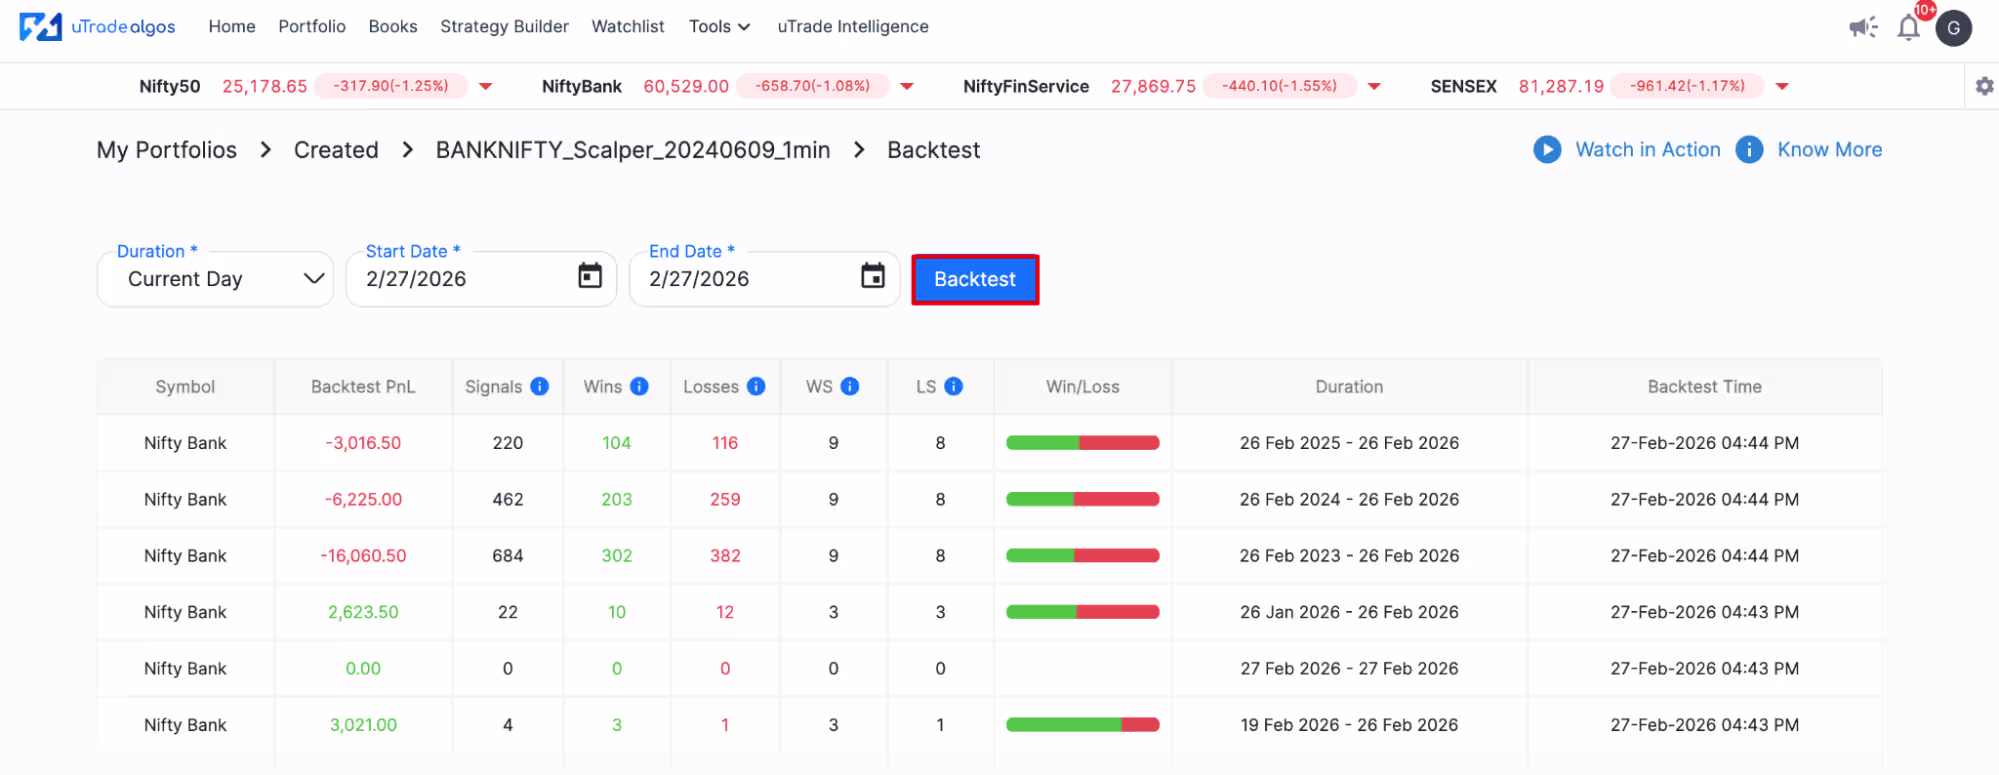
After configuring your duration, click the blue Backtest button. uTrade Algos immediately begins processing:
What Happens During Backtesting: The platform loads historical market data for your specified period, applies your strategy's entry and exit logic to every data point, simulates trade execution (entries, exits, stop losses, targets), calculates profit/loss for each trade, and aggregates results into comprehensive performance metrics.
Once complete, results appear automatically below the backtest button.
Step 5: Review Backtest Summary
After processing completes, a summary table displays with one row per symbol tested (or one row for single-symbol strategies). Key columns include:
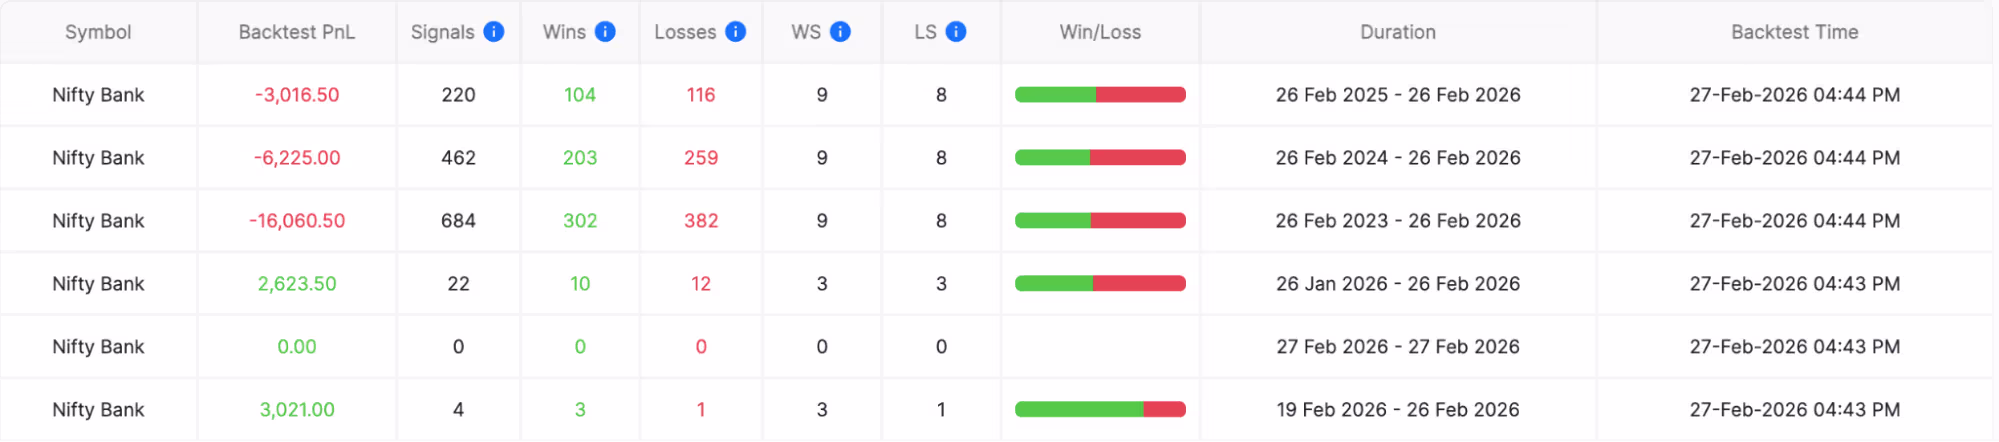
Symbol: The instrument traded (NIFTY, BANKNIFTY, specific stocks)
Backtest P/L: Total profit or loss generated during the test period. Positive numbers indicate profitable strategies; negative numbers show losing performance.
Signals: Total number of trade signals generated. High signal counts might indicate overtrading; very low counts might mean insufficient opportunities.
Wins: Number of profitable trades closed. Combined with total trades, this calculates win rate.
Losses: Number of losing trades closed. Every strategy has losses—what matters is their size relative to wins.
Winning Streak (WS): Maximum consecutive winning trades. Shows best-case momentum.
Losing Streak (LS): Maximum consecutive losing trades. Critical for understanding psychological difficulty and drawdown potential.
Win/Loss Ratio: Visual representation (often shown as colored bars) comparing wins to losses. Green sections represent wins; red represents losses.
Duration: The exact date range tested, confirming your selected period.
Backtest Time: Timestamp showing when this backtest was executed, useful when comparing multiple test runs.
This summary provides quick insight into strategy viability. Positive P/L with reasonable win rates (typically 45-60% for most strategies) and manageable losing streaks indicate potentially deployable algorithms.
Step 6: Access Detailed Analysis
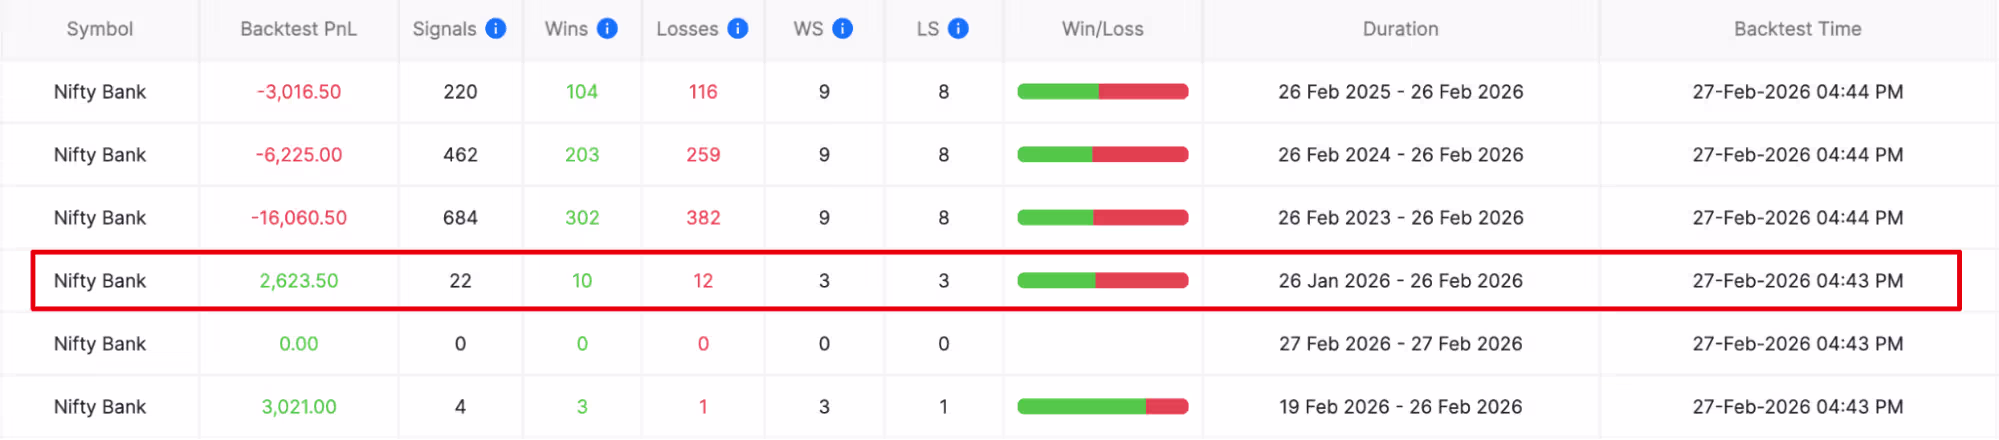
For deeper insight beyond the summary, click on any row in the results table. This opens a comprehensive analysis window with three tabs containing detailed backtesting data.
The detailed view appears as an overlay or expanded section showing:
- Complete trade-by-trade breakdown
- Performance visualizations
- Statistical analysis
- Risk metrics
- Monthly performance patterns
Navigate between tabs to access different analysis perspectives. Each tab provides specific insights crucial for understanding strategy behavior and making informed deployment decisions.
Step 7: Analyze Performance Data (Tab 1: Analysis)
The Analysis tab presents comprehensive performance metrics and visualizations. You can also add slippages in order to backtest the data in a more realistic manner:
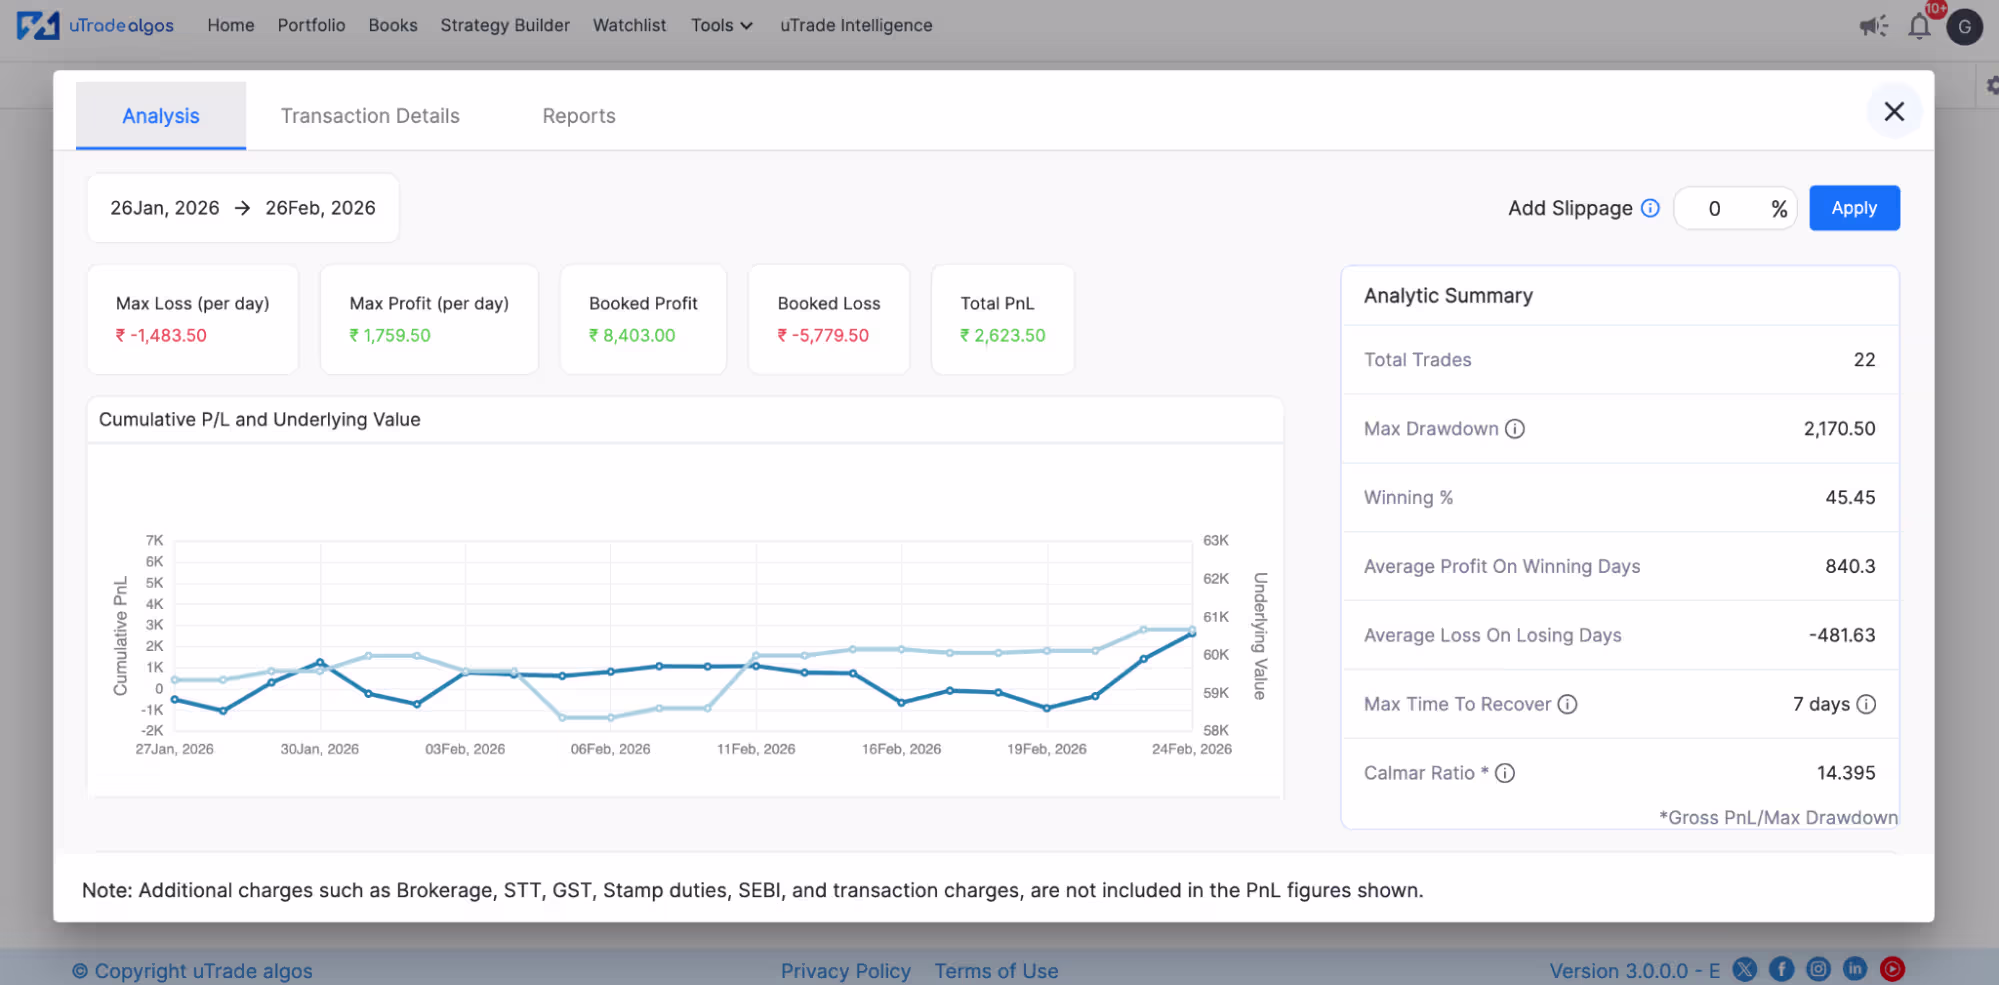
Analytical Summary:
- Total P&L: Overall profit/loss across the entire test period
- Booked Profit: Aggregate profits from all winning trades
- Booked Loss: Aggregate losses from all losing trades
- Max Profit: Largest single winning trade
- Max Loss: Largest single losing trade
- Average Win: Mean profit per winning trade
- Average Loss: Mean loss per losing trade
- Profit Factor: Ratio of gross profit to gross loss (values above 1.5 indicate robust strategies)
- Return on Maximum Drawdown: Measures reward relative to the worst peak-to-trough decline
Performance Visualizations:
- Equity Curve: Line graph showing cumulative P&L over time. Smooth upward slopes indicate consistent performance; jagged patterns show volatility.
- Drawdown Chart: Displays peak-to-trough declines. Shows when and how severely the strategy lost value from previous highs.
- Win/Loss Distribution: Histogram showing frequency of different profit/loss amounts, revealing whether strategy generates many small wins or few large wins.
These metrics help assess whether strategy performance justifies the risk. High max loss relative to average win, for example, signals problematic risk-reward ratios.
Step 8: Review Transaction Details (Tab 2: Transactions)
The Transaction Details tab provides a complete trade log—every entry and exit the strategy would have executed:
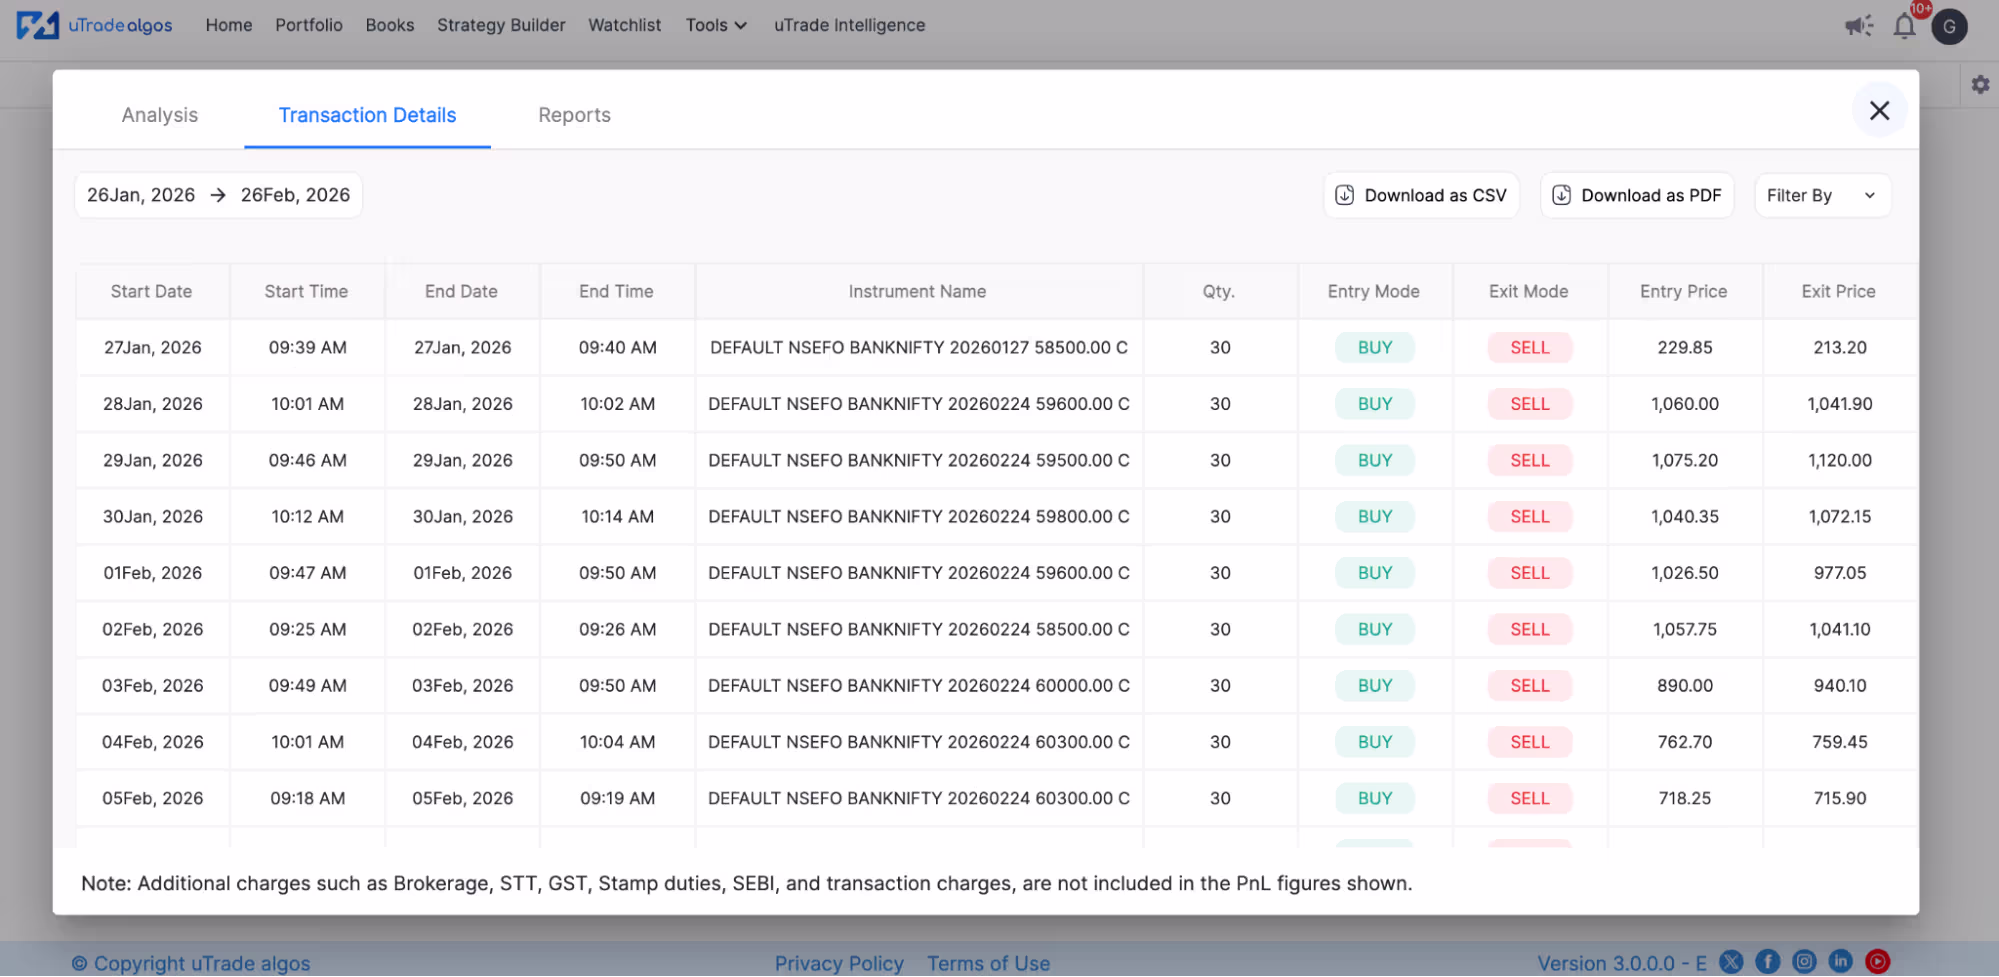
Trade Log Columns:
- Date/Time: Exact timestamp of entry or exit
- Action: BUY, SELL, or EXIT indicator
- Symbol: Instrument traded
- Strike/Expiry: For options strategies, specific contract details
- Quantity: Position size (number of shares or lots)
- Entry Price: Price at which position opened
- Exit Price: Price at which position closed
- P&L: Profit or loss for that specific trade
- Exit Reason: Why position closed (target hit, stop loss triggered, square-off time, manual exit)
What to Look For:
- Are entries occurring at expected times and prices?
- Do exits trigger appropriately based on your rules?
- Are there execution patterns you didn't anticipate?
- Do losing trades consistently hit stop losses or square-off times?
- Are winning trades exiting at targets or trailing stops?
This granular view helps validate that backtesting accurately represents your strategy logic. Unexpected entry/exit patterns might indicate logic errors requiring correction before live deployment.
Step 9: Examine Monthly Reports (Tab 3: Reports)
The Reports tab displays a calendar-based monthly performance view with color-coded daily results:
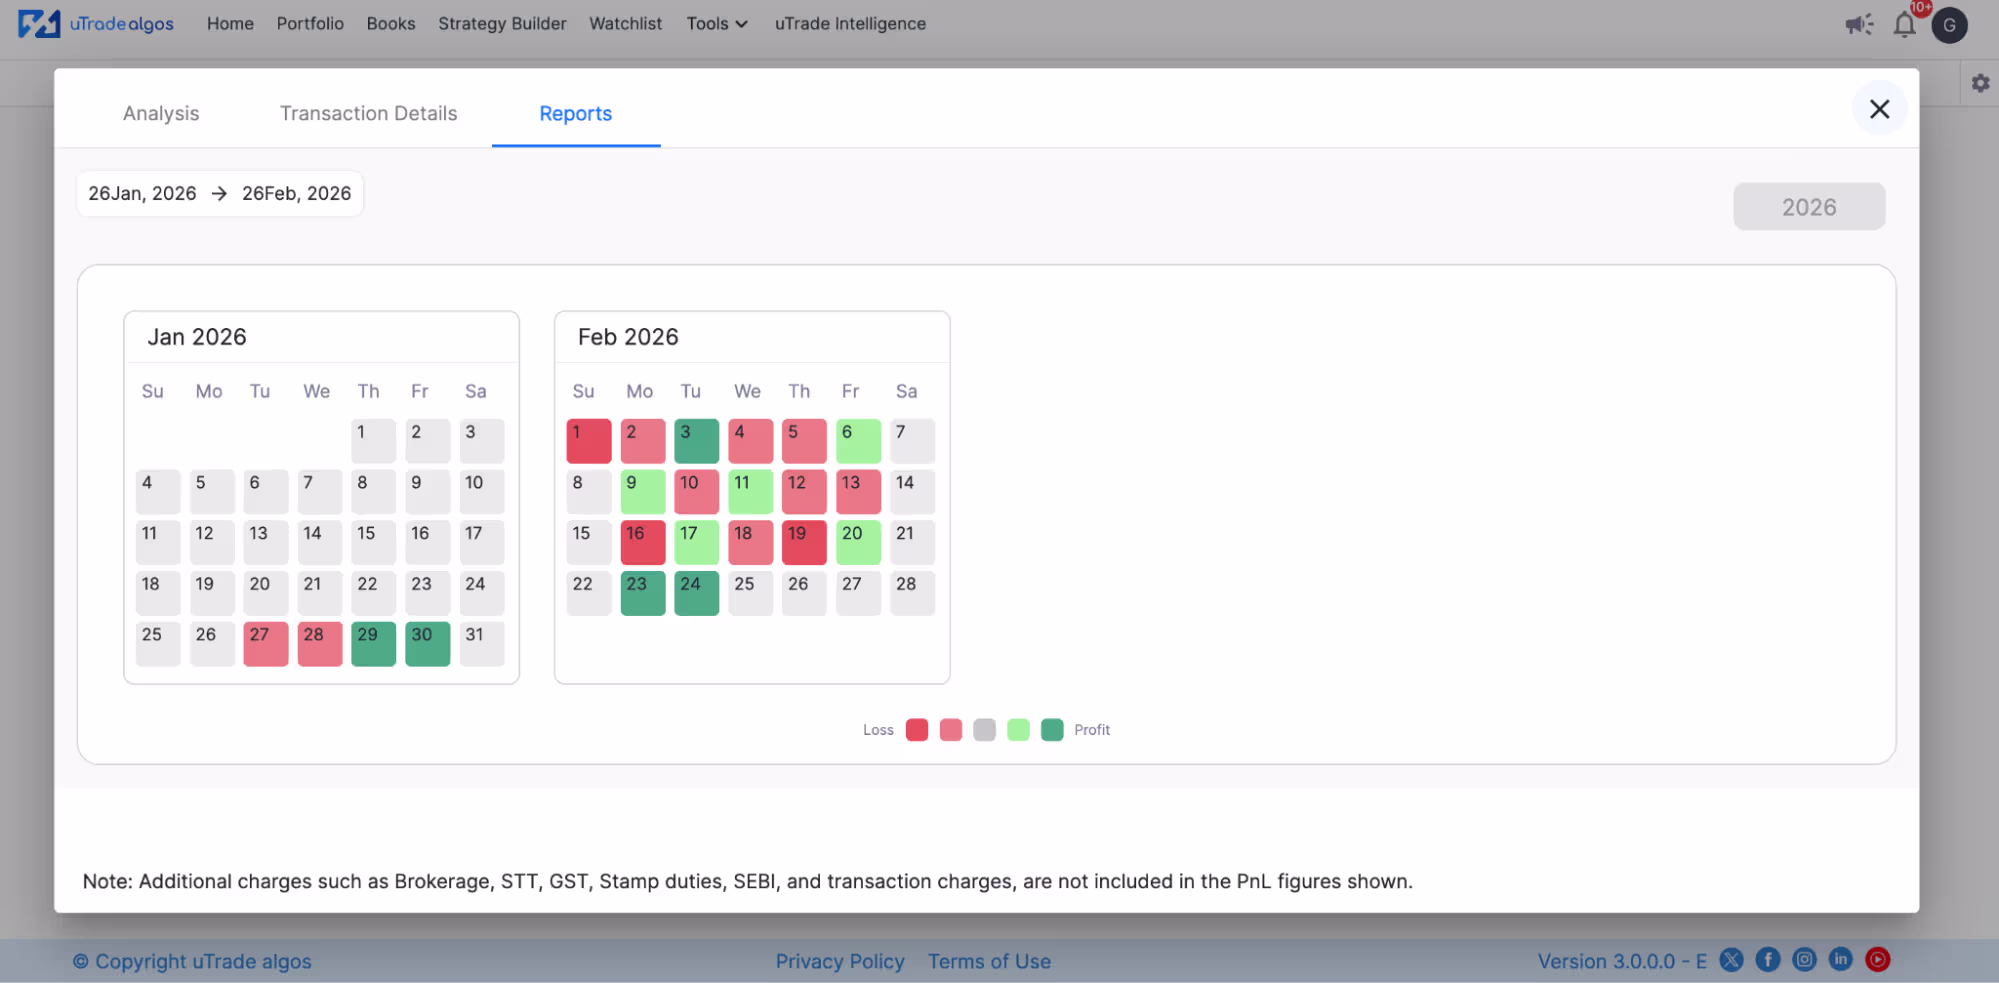
Color Coding System:
- Dark Red: Significant daily loss
- Light Red: Minor daily loss
- Grey: No trades executed that day
- Light Green: Minor daily profit
- Dark Green: Significant daily profit
The intensity gradient helps you quickly identify best and worst trading days. Patterns emerge showing whether the strategy performs better on specific days of the week, month beginnings/endings, or during particular market conditions.
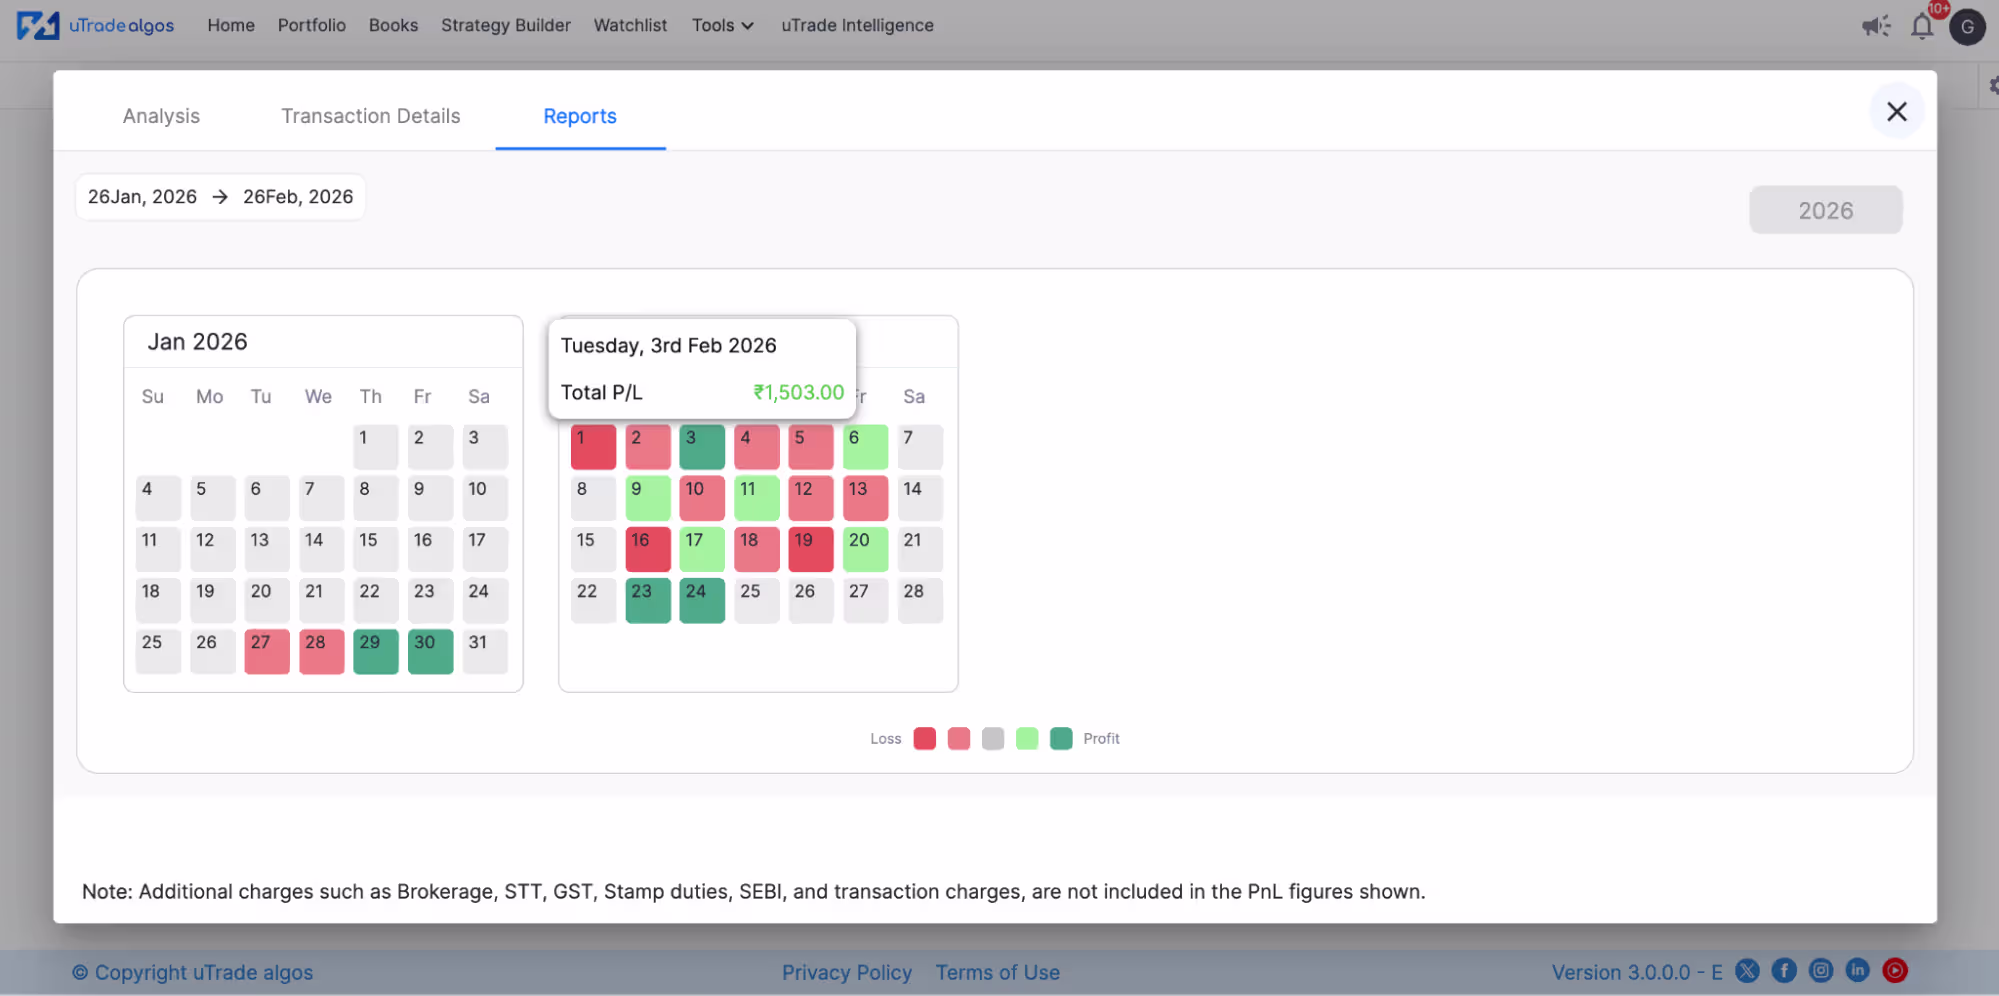
Interactive Calendar: Hover your mouse over any date to see exact P&L for that trading day. This interactivity allows detailed exploration without cluttering the interface.
Pattern Recognition: Use this calendar view to spot:
- Consecutive losing days (might indicate unfavorable market regimes)
- Clustering of profits or losses
- Seasonal performance variations
- Impact of specific events (earnings seasons, policy announcements, volatility spikes)
The monthly calendar perspective complements the trade-by-trade transaction log, providing macro-level insights into strategy consistency and reliability across extended periods.
Step 10: Interpret Results and Make Decisions
After reviewing all tabs, synthesize findings into actionable decisions:
- Positive Indicators = Deployment
- Warning Signs = Modify or Reject
Next Steps Based on Results:
If Backtest Passes:
Proceed to forward testing in simulation before live deployment. Backtesting shows what worked historically; forward testing validates current relevance.
If Backtest Fails:
Modify parameters (stop losses, entry conditions, position sizing), re-backtest, and compare results. Iterate until performance improves or conclude the strategy concept is flawed.
If Results are Marginal:
Test different durations to verify consistency. A strategy profitable over 1 year but losing over 3 years suggests market regime dependency requiring careful deployment timing.
Backtesting across complete market cycles provides an honest assessment of how strategies perform in all environments they'll eventually face.
Conclusion
Every successful algo trader shares one habit: they test before they trade. Backtesting algo trading strategies on uTrade Algos transforms guesswork into evidence, replacing hope with data-driven confidence.
You've learned the complete workflow—strategy selection, duration configuration, results interpretation, and decision-making based on comprehensive analytics.
The platform makes algo backtesting accessible to everyone, removing technical barriers that once limited this crucial validation to programmers. Your strategies are ready. Historical data awaits. Test them now, understand their behavior, and deploy only what evidence supports.
Frequently Asked Questions (FAQs)
How far back should I backtest my algo trading strategy?
Backtest at least 1-2 years for meaningful results. Longer periods (2-3 years) test strategy robustness across different market regimes. Ensure your test includes at least 30-50 trades for statistical significance, regardless of time duration selected.
What is a good win rate for algo backtesting results?
Win rates between 45-65% are typical for profitable strategies. Higher isn't necessarily better—strategies with 40% win rates can be profitable if winning trades significantly exceed losing trades in size. Focus on overall P&L and profit factor, not just win rate.
Can I backtest strategies without creating them first on uTrade Algos?
No. You must create or select a strategy before backtesting. Use AI Strategy Builder for quick creation, select pre-built strategies from Originals, or build custom strategies via Strategy Builder. All options provide immediate backtesting access after strategy definition.
How does uTrade Algos backtesting differ from manual backtesting?
uTrade Algos automates everything—data retrieval, trade simulation, P&L calculation, and visualization. Manual backtesting requires downloading data, coding logic, running simulations, and creating reports. uTrade completes in seconds what manual methods take hours to accomplish.
Should I deploy a strategy immediately after positive backtest results?
No. Positive backtests warrant forward testing next—deploying in simulation to validate current market performance. Only after successful forward testing with acceptable results should you consider live deployment, starting with small position sizes.