Introduction
Most traders focus on placing trades but forget to track whether those trades are actually making money. Knowing your P&L is not just a number — it is a feedback loop that tells you what is working, what is not, and where your strategy stands.
uTrade Algos gives you a dedicated P&L Reports section that makes this visibility simple, structured, and actionable.
Whether you are running an AI-generated strategy, a pre-built expert strategy, or a custom form-based strategy, your profit and loss data is always a few clicks away — organised, colour-coded, and exportable.
Step-by-Step: How to Track Your P&L on uTrade Algos
Step 1: Deploy a Strategy First
P&L tracking is tied to deployed strategies. Before you can view any report, you need at least one active or previously deployed strategy on your account. This can be:
- An AI-generated strategy created using the uTrade AI Strategy Builder
- A pre-built expert strategy selected from uTrade Originals
- A custom strategy built using the form-based uTrade Strategy Builder
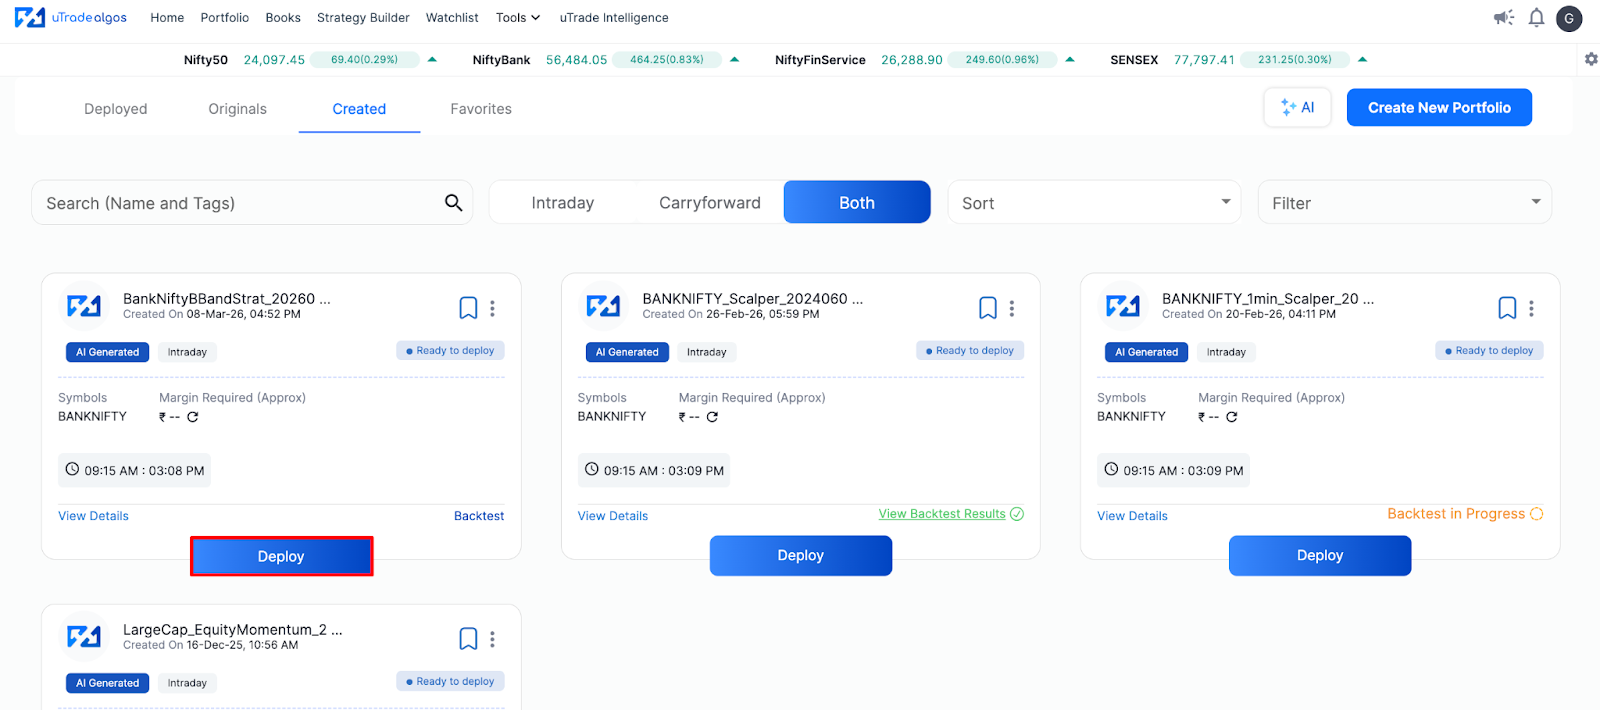
Once a strategy is deployed and begins executing trades, the platform automatically logs the P&L for each trade in the background.
Step 2: Go to My Profile

- Click on the Profile icon located at the top-right corner of the uTrade Algos screen.
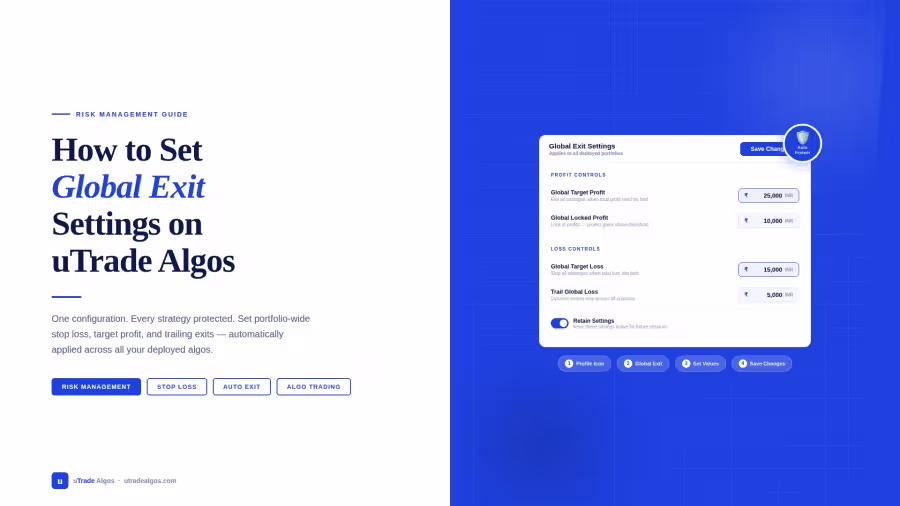
- A dropdown menu will appear with multiple options including My Profile, Manage Brokers, Global Exit Settings, and more.
- Click on My Profile to open your account page.
Step 3: Click on the PnL Reports Tab

On your profile page, you will see a row of tabs at the top — Profile, Plans & Pricing, PnL Reports, Transaction History, Active Sessions, and Help. Click on the PnL Reports tab, which is the third tab in the row. This will open the P&L reporting section.

You can also see the PnL Report Overview as “Financial Overview” on the homepage of the dashboard.
Step 4: Apply Your Filters
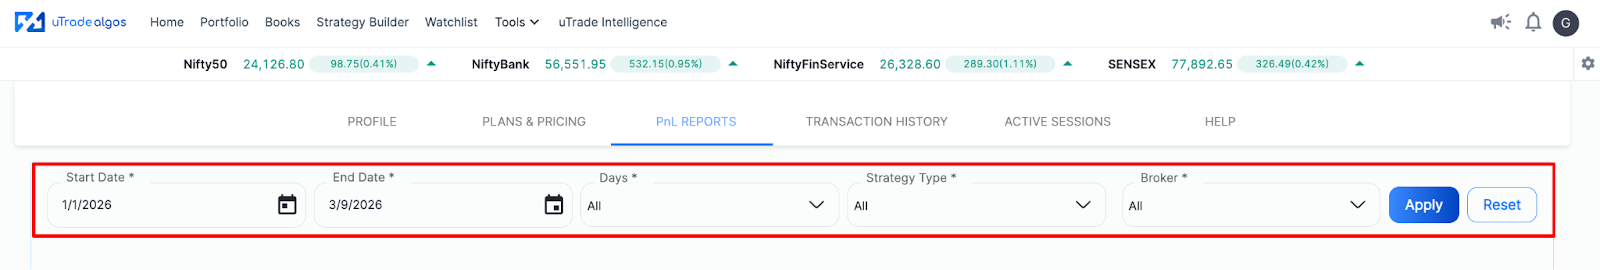
The P&L Reports screen opens with a filter bar at the top. Use these filters to customise what you want to see:
- Start Date — select the beginning of the period you want to review
- End Date — select the end date for your report
- Days — filter by specific trading days if needed (default is All)
- Strategy Type — choose a specific strategy type or select All to view P&L across every strategy you have deployed
- Broker — select a specific broker (Angel One, Fyers, Dhan, Share India, etc.) or choose All to see P&L across all connected brokers
Once your filters are set, click the Apply button. The platform will load the results for the selected parameters. You can use the Reset button to clear all filters and start fresh.
Step 5: Read the Colour-Coded Calendar View

The results are displayed as a calendar heatmap — a visual grid that shows every trading day within your selected date range. Each day is colour-coded to instantly communicate performance:
- Dark Green — profitable day with higher returns
- Light Green — profitable day with moderate or lower returns
- Grey — no trades executed on that day
- Light Red — loss day with smaller losses
- Dark Red — loss day with higher losses
This colour gradient from green to red gives you an instant visual of your trading performance over time — no need to read through rows of numbers to understand the trend.
Step 6: Export or Download Your Report
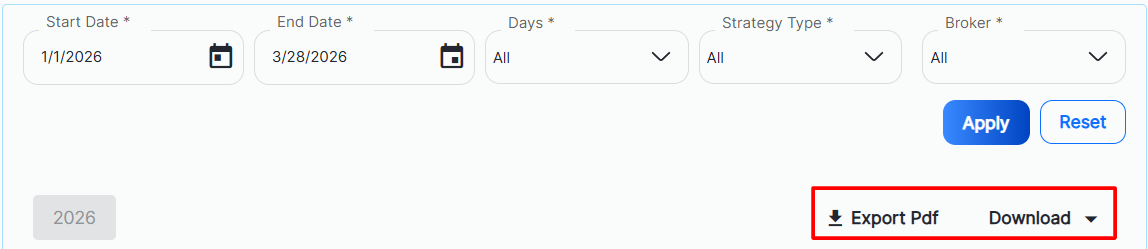
Once you have reviewed the calendar view, you have two options to take the data further:
- Export PDF — generates a downloadable PDF of your P&L report for the selected period, useful for record-keeping or sharing
- Download — offers two download formats:
- Strategy Wise — breaks down P&L by individual strategy
- Day Wise — shows P&L organised by each trading day
You can modify the filters at any time and re-apply them to generate a fresh view of your report without losing your previous settings.
How to Read the P&L Calendar Correctly
The calendar view is intuitive, but knowing how to read it correctly helps you extract more meaningful insights from it.
Start by looking at the overall colour pattern across your selected date range. A majority of green cells signals that your deployed strategies are performing well over that period. A cluster of red cells — especially dark red — signals a drawdown phase that may need attention, either by pausing the strategy or reviewing its parameters.
The grey cells are equally important. Too many grey days might mean your strategy is not finding enough trade setups, which could indicate overly restrictive entry conditions. Conversely, strategies that trade every single day with mixed colours may need tighter filters.
Use the Strategy Type filter to isolate individual strategies and compare their performance side by side. A strategy that looks mediocre in the All view might actually be your best performer once you separate it from a losing one. This level of granularity helps you make smarter deployment decisions going forward.
Conclusion
Your P&L report is not just a record of what happened — it is a tool that shapes what you do next. uTrade Algos makes this visibility effortless with its colour-coded calendar, flexible filters, and export options that put your performance data right where you need it.
The more consistently you review your P&L, the better you understand which strategies deserve capital and which need rethinking. If you have not explored your P&L Reports yet, now is a good time to log in, apply your filters, and start reading your trading story the way it was meant to be read.
Frequently Asked Questions (FAQs)
Does the P&L on uTrade Algos include brokerage and taxes?
No. The P&L figures displayed on uTrade Algos do not include brokerage, STT, GST, stamp duties, SEBI charges, or transaction charges. These are excluded from the figures shown, so your actual net P&L may differ after accounting for all applicable charges.
Can I view P&L for a specific broker only?
Yes. The P&L Reports section has a Broker dropdown that lets you filter results by a specific connected broker such as Angel One, Fyers, Dhan, or Share India. Selecting All shows the combined P&L across every broker connected to your account.
What does the grey colour on the P&L calendar mean?
Grey cells on the P&L calendar indicate days when no trades were executed by your deployed strategies. This could be due to market holidays, weekends, or the strategy not finding a valid entry condition on that day.
Can I download my P&L report from uTrade Algos?
Yes. You can either export the report as a PDF or download it in two formats — Strategy Wise, which shows P&L broken down by each strategy, or Day Wise, which shows P&L organised by individual trading days.
Do I need to deploy a strategy before I can see P&L reports?
Yes. The P&L Reports section only shows data for strategies that have been deployed and have executed trades on your account. If no strategies have been deployed yet, the report will not have any data to display.