
.avif)
Introduction
Many new traders in India begin algorithmic trading with one simple question:
Which indicators work best for algo trading in India?
They hear traders discussing RSI, EMA crossovers, MACD, VWAP, ATR, and Supertrend, assuming success comes from finding the “perfect” indicator.
But the reality is different. There is no single best indicator for algorithmic trading in India. Indicators used in NSE and BSE markets perform differently depending on market conditions, trading style, and risk management.
The right indicator depends on:
- Your trading style (intraday, swing, or positional)
- Current market conditions
- Your experience level
- Your risk appetite
- How well your strategy is tested and managed
A strategy that works well in a trending market may fail badly during sideways consolidation. Similarly, some Indian stock market indicators perform better during high volatility, while others are designed for stable trends.
Understanding when to use an indicator is far more important than blindly searching for the “best” one.
Before diving deeper, let’s first understand which indicators are commonly used in professional and retail Algo trading strategies India.
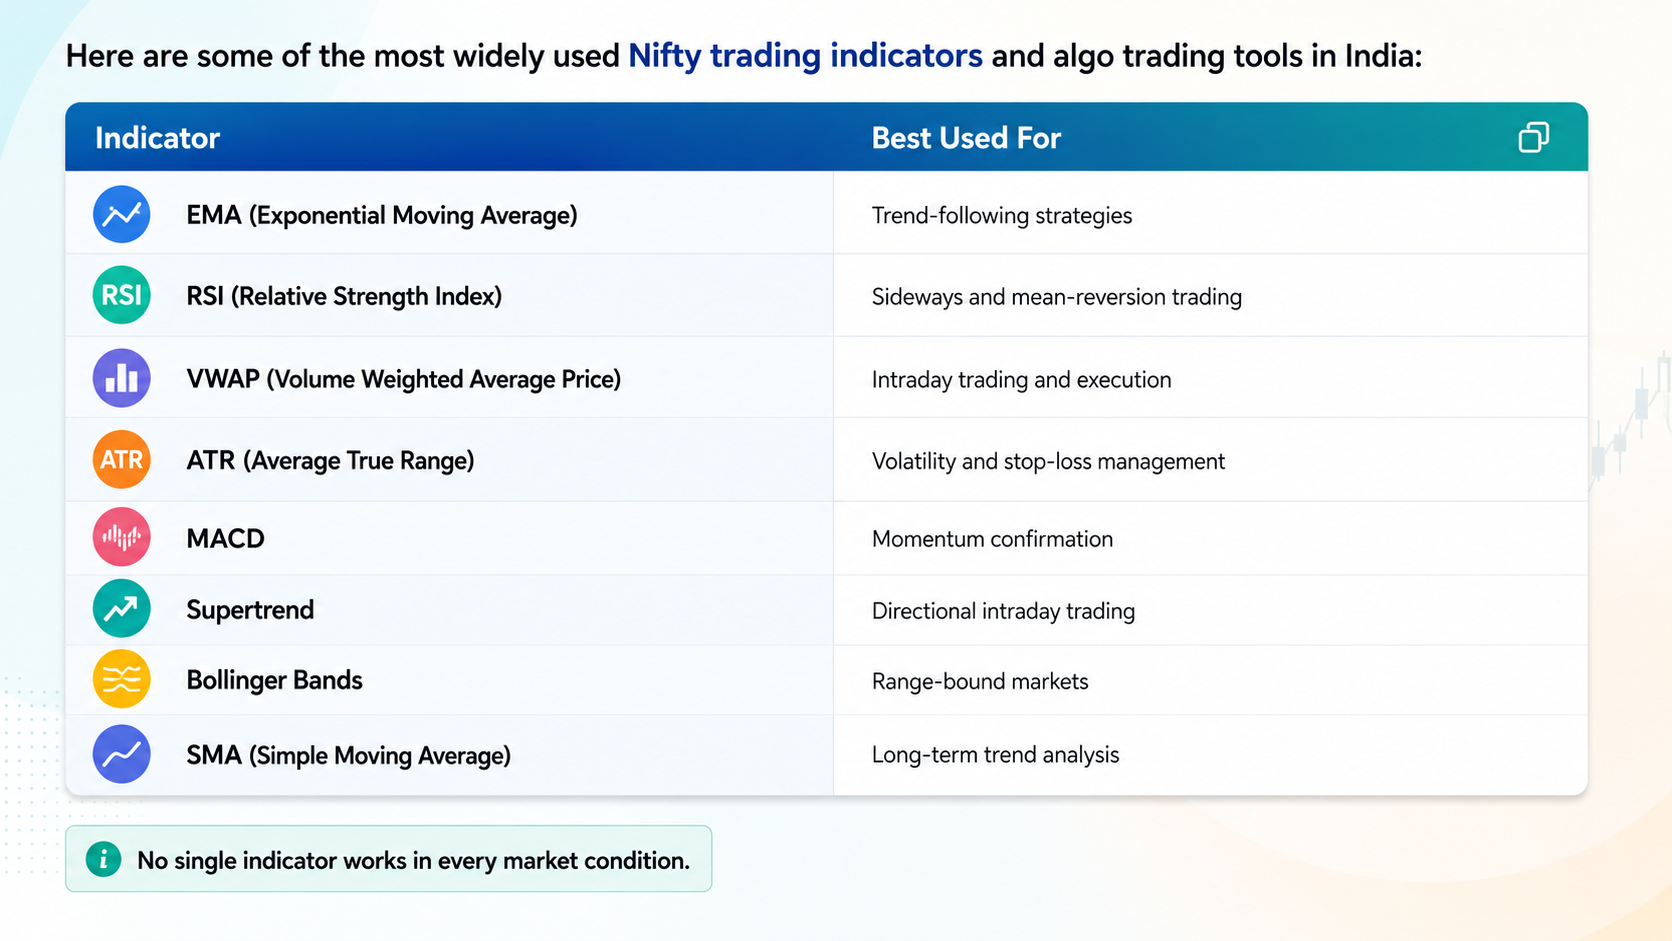
Best Indicators for Algo Trading in India
Different indicators solve different trading problems. Some identify trends, some measure momentum, and others help manage volatility and execution.
Now, to answer which are the Best Indicators for Algo Trading in India. Let's understand it with Rahul’s story. His story shows why the “best” indicator changes based on your stage as a trader.
Rahul’s First Month: Just Beginning with Algo Trading
Rahul had been manually trading Indian stocks for a few months.
Like many retail traders, he made emotional decisions:
- Buying after seeing social media hype
- Exiting too early from winning trades
- Holding losses too long
After repeated mistakes, he discovered uTrade Algos, an AI-powered platform designed to make algorithmic trading accessible to retail traders.
What attracted him was its beginner-friendly setup:
- Pre-built algo strategies
- No-code strategy deployment
- Institutional-grade tools simplified for individuals
- AI-powered assistance through uTrade Intelligence
Rahul didn’t need to code or build complex models.
He simply needed a reliable indicator framework.
The Market Situation
At that time, the Indian market was moving strongly upward after positive economic news.
This was a favorable environment for trend-following strategies.
Rahul asked uTrade Intelligence:
“Which indicator-based strategy would work best in this market condition?”
After analyzing the trend strength and market momentum, uTrade Intelligence suggested an EMA-based trend-following strategy because moving average indicators generally perform well during strong directional markets.
The AI explained that EMA indicators react faster to price changes and help traders capture ongoing trends more effectively. Rahul deployed the strategy directly through the platform without needing any coding knowledge.
Why the EMA-Based Strategy Worked for Rahul
The EMA-based strategy was designed to follow strong market trends while avoiding emotional decision-making.
The system automatically generated buy and sell signals based on predefined mathematical conditions.
For the first time, Rahul experienced:
- Discipline
- Structured execution
- Consistency
There was:
- No guesswork
- No emotional entries
- No panic exits
The algorithm simply followed rules.
For a beginner, this simplicity was extremely powerful.
Rahul as an Experienced Trader: Changing Strategy with Conditions
Now Rahul understood how market structure affects indicator performance.
Using uTrade’s strategy creation tools and uTrade Intelligence, he analyzed why EMA was underperforming.
The AI insights suggested a shift toward mean-reversion logic.
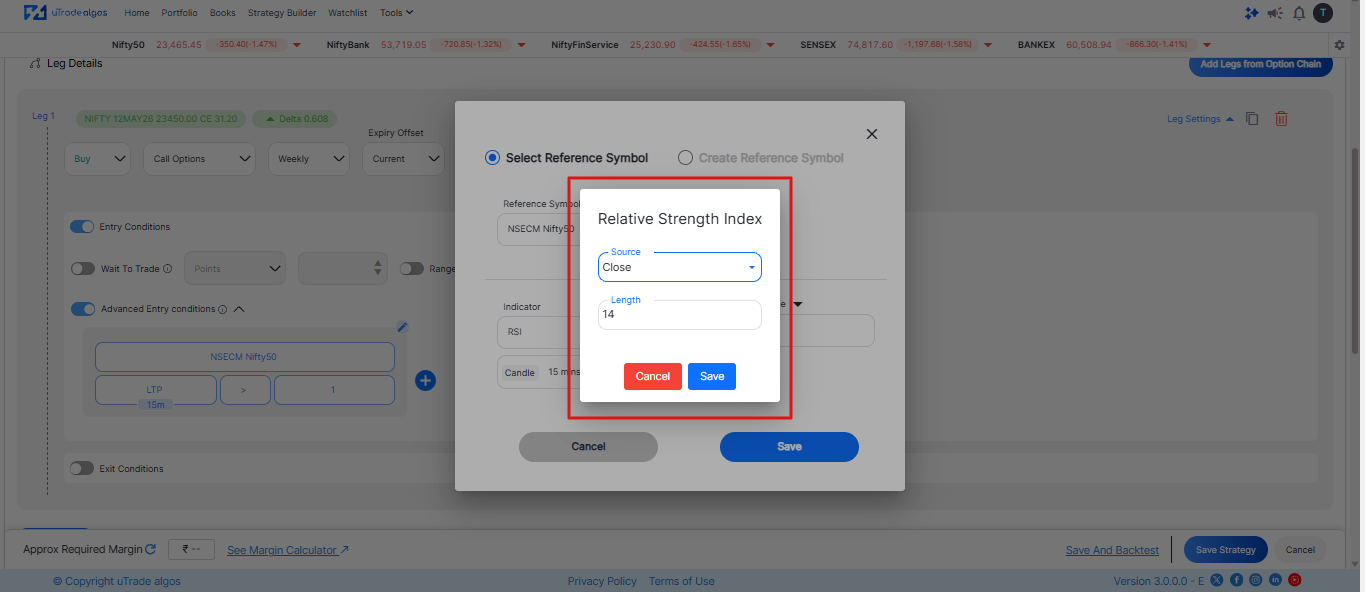
He switched to RSI-based trading.
Why RSI Worked Better
The Relative Strength Index measures momentum on a scale from 0 to 100.
Traditional interpretation:
- Above 70 = Overbought
- Below 30 = Oversold
In a sideways market, this worked perfectly.
Rahul’s algo rules:
- Buy when RSI dropped below 30
- Exit near RSI 55–60
- Sell when RSI rose above 70
This setup fit the market condition far better than EMA.
The same trader.
Same platform.
Different market.
Different indicator.
That’s the point.
There is no universal best indicator. There is only the best fit for different market conditions and different types of traders.
Why uTrade Algos Works for Both Beginners and Experts
Rahul stayed with uTrade Algos because it evolved with him.
As a beginner, he used:
- Ready-made strategies
- Easy deployment
- Simple automation tools
As an advanced trader, he used:
- Custom strategy creation
- Multi-indicator combinations
- AI-powered optimization via uTrade Intelligence
- Institutional-level execution tools
It’s rare to find a platform that serves both first-time algo traders and experienced quants equally well.
That balance makes it powerful.
If you’re just starting, exploring a few pre-built strategies can help you learn faster without feeling overwhelmed.
Indicators Available on uTrade Algos
uTrade Algos provides a wide range of technical indicators to help traders build smart, rule-based strategies without complex coding. Here’s a quick one-line introduction to each:
- ATR (Average True Range): Measures market volatility by showing how much price moves on average.
- Bollinger Bands: Shows price volatility with upper and lower bands around a moving average.
- Close Price: The final price at which a candle closes.
- DEMA (Double Exponential Moving Average): A faster moving average that reduces lag compared to EMA.
- Exponential Moving Average (EMA): A moving average that gives more weight to recent prices.
- High Price: The highest price reached during a candle.
- Low Price: The lowest price reached during a candle.
- LTP (Last Traded Price): The most recent price at which a trade occurred.
- MACD Histogram: Shows the difference between MACD line and signal line to indicate momentum strength.
- MACD Line: Tracks the difference between two EMAs to identify trend direction.
- MACD Signal Line: A smoothed line used to generate buy/sell signals with MACD.
- Open Price: The price at which a candle starts.
- RSI (Relative Strength Index): Measures whether a stock is overbought or oversold.
- Simple Moving Average (SMA): The average price over a specific time period.
- Supertrend Indicator: Helps identify the current market trend (uptrend or downtrend).
- TEMA (Triple Exponential Moving Average): An advanced moving average that further reduces lag.
- Volume of Candle: Shows the total number of shares/contracts traded in a candle.
- VWAP (Volume Weighted Average Price): The average price weighted by volume, often used by intraday traders.
- Weighted Moving Average (WMA): A moving average that assigns different weights to prices.
More indicators and advanced strategy concepts coming soon…
Conclusion
The debate about the "best" indicator for algo trading in India misses the point. The real skill is knowing which indicator fits your current market regime and trading goal. Trend-following? EMA crossovers. Range-bound chop? RSI + VWAP. Risk management in all conditions? ATR, always.
Algorithmic trading removes emotion from execution — but it doesn't remove judgment from strategy design. That judgment, built over time through testing and iteration, is what separates successful algo traders. Platforms like uTrade Algos accelerate that learning curve by putting institutional-grade tools — AI analytics, pre-built strategies, powerful backtesting — in the hands of retail traders from day one.
Suggested Read:
6 Essential Tips for Optimising Your Algorithmic Trades With the uTrade Algos App
Frequently asked questions (FAQs)
Can I run multiple indicators simultaneously in a single algo strategy?
Yes — and in practice, the best strategies almost always do. The key is that each indicator should serve a distinct role: one as a directional filter (like VWAP), one for entry timing (like RSI), and one for confirmation (like MACD). Stacking three indicators that all measure the same thing — say, three different trend-following tools — just creates redundancy without improving accuracy.
Do these indicators work the same way on NSE and BSE?
Mostly yes, but liquidity differences matter. VWAP, for instance, is far more reliable on heavily traded NSE instruments like Nifty 50 constituents than on low-volume BSE stocks. On illiquid counters, the VWAP line can be easily distorted by a few large orders, making it a weaker signal. As a rule, apply indicator-based algos to liquid instruments first.
How frequently should I re-optimise my indicator parameters?
There's no universal answer, but a practical approach is to review parameters whenever your strategy's win rate drops meaningfully from its backtested baseline over a 4–6 week live period. Markets shift regime periodically — what worked during a trending phase may underperform in a sideways one. That said, over-optimising (tweaking constantly) introduces curve-fitting risk. The goal is adaptation, not constant tinkering.
Is algo trading legal for retail investors in India?
Yes. SEBI has regulations in place for algorithmic trading, and retail investors can participate through SEBI-registered brokers who offer algo platforms. You don't need to be an institutional player. Platforms that operate within SEBI's framework allow retail traders to deploy automated strategies on live exchanges, including NSE and BSE.
What's the difference between backtesting and paper trading, and do I need both?
Backtesting runs your strategy against historical data to see how it would have performed. Paper trading runs your strategy on live data without real money. Both are necessary. Backtesting helps you validate the logic and tune parameters; paper trading exposes you to real-world conditions like slippage, order latency, and market impact that historical simulations can't fully replicate. Think of backtesting as your theory exam and paper trading as your practical.
.avif)
.avif)
.avif)
.avif)
.avif)
.avif)
.avif)


