
%20Intelligence.avif)
Introduction
Most stock analysis takes hours you'll never get back. Spreadsheets, financial statements, technical charts, news scanning—by the time you finish evaluating one company, market opportunities have evaporated.
uTrade AI Stock Analysis compresses this exhaustive process into conversational seconds. Instead of manually gathering data across multiple sources, you simply ask "Analyze this stock in detail" and receive comprehensive fundamental analysis, technical indicators, corporate events, analyst ratings, and investment thesis—all structured, current, and actionable.
This AI stock analysis tool within uTrade Intelligence transforms research from tedious work into instant insight, making professional-grade stock market analysis accessible to everyone through plain English queries.
How to Analyze Stocks with AI with uTrade (AI) Intelligence
Step 1: Log in and Access uTrade Intelligence
Navigate to uTrade Algos at utradealgos.com and log in using your registered credentials. Once authenticated, you land on the main dashboard.
.avif)
From the main dashboard, locate the search or query input field—often a prominent search bar or dedicated AI assistant chat interface designed specifically for research, analysis, and market intelligence queries.
Step 2: Write Your Initial Query
In the input field, describe what you want to analyze. For this tutorial, we'll start with a broad screening query before narrowing to a detailed analysis.
.png.avif)
Example Initial Query: "Screen momentum stocks"
This intentionally vague query demonstrates the AI's ability to interpret general intent and provide relevant results without requiring technical screening syntax.
What Happens Next: uTrade AI Intelligence interprets your general request, understanding that the "momentum stocks" conceptually relates to:
- Recent breakout patterns
- Stocks near or at 52-week highs
- Strong trading volume indicating interests
- Technical momentum indicators are showing strength
The AI automatically refines your vague query into a precise screening definition.
Step 3: Review AI-Interpreted Query and Results
Within seconds, uTrade Intelligence responds with:
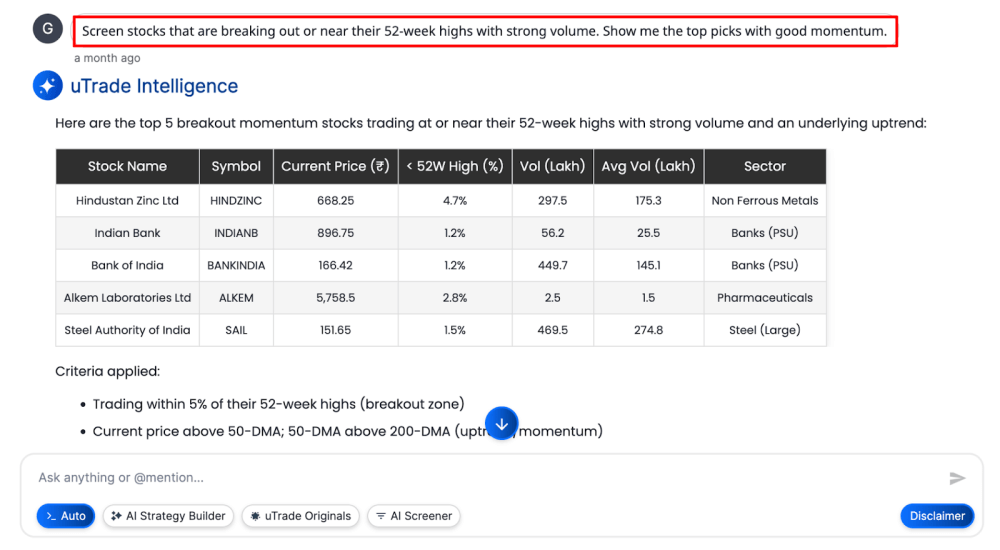
Refined Query Definition: "Screen stocks that are breaking out or near their 52-week highs with strong volume. Show me the top picks with good momentum."
This demonstrates the AI's interpretive capability—translating your simple "momentum stocks" into specific, actionable screening criteria.
Screening Results Table:
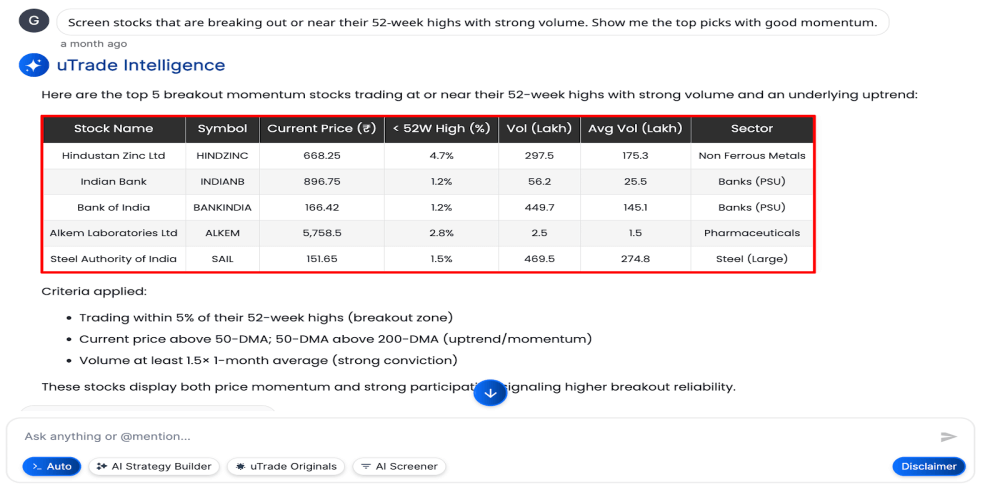
The response includes a structured table with columns:
- Stock Name: Full company name
- Symbol: Stock ticker
- Current Price (₹): Latest trading price
- < 52W High (%): Percentage below 52-week high (stocks near peaks show small percentages)
- Vol (Lakh): Recent trading volume in lakhs
- Avg Vol (Lakh): Average volume for comparison (current volume significantly above average indicates momentum)
- Sector: Industry classification
This screening provides a starting point—stocks exhibiting momentum characteristics worth deeper investigation.
Step 4: Request Detailed Stock Analysis
From the screening results, select a stock for comprehensive evaluation. For this tutorial, we'll analyze Hindustan Zinc Ltd.
Analysis Query: "Analyze Hindustan Zinc Ltd in detail."
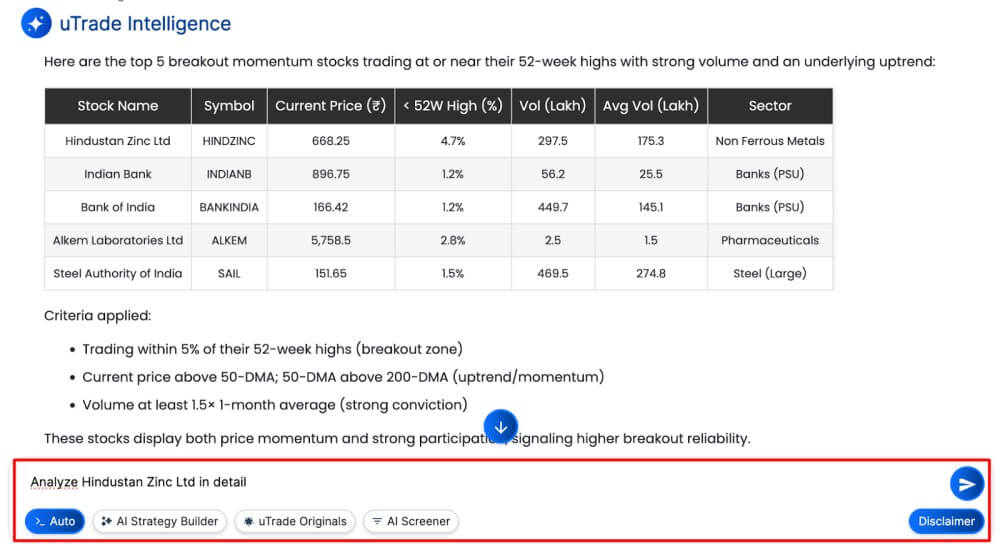
uTrade Intelligence often suggests related queries at the end of screening results, including analysis of individual screened stocks. You can click these suggestions or type your own analysis request.
After submitting, the AI immediately begins comprehensive data aggregation and analysis.
Step 5: Review Comprehensive Analysis Results
Within seconds, uTrade AI Stock Analysis delivers a complete, structured evaluation organized into clear sections:
Current Market Data
The analysis opens with a real-time market snapshot:

Here's what you understand from it:
- Where the stock stands right now — current price, today's price movement, and intraday high/low
- Historical context — whether the stock is near its 52-week high or low, giving you a sense of momentum or correction
- Volume activity — whether today's trading volume is unusually high or low compared to its average, signaling whether there is strong interest or quiet activity in the stock
- Quick directional sense — whether the stock is in an active momentum phase or a quiet consolidation, before you even dive deeper into analysis
This section provides immediate context—where the stock trades now and its recent price action.
Technical Analysis
This section tells you what the price action and trading data are signaling about the stock's short to medium-term direction. It is broken into three parts:
Key Technical Indicators:

Here's what you understand from it:
- Whether the stock is in a bullish or bearish phase, as per the momentum indicator
- Whether the stock is in a buying or selling phase
- How strong or weak the prevailing trend is — helping you decide if the move is sustainable or fading
Moving Averages

Here's what you understand from it:
- Whether the stock is trading above or below its short-term averages, medium-term averages, and long-term averages
- Trading above all major averages is a sign of strength, while trading below all averages is a sign of weakness or a chance to buy
Support & Resistance Levels:
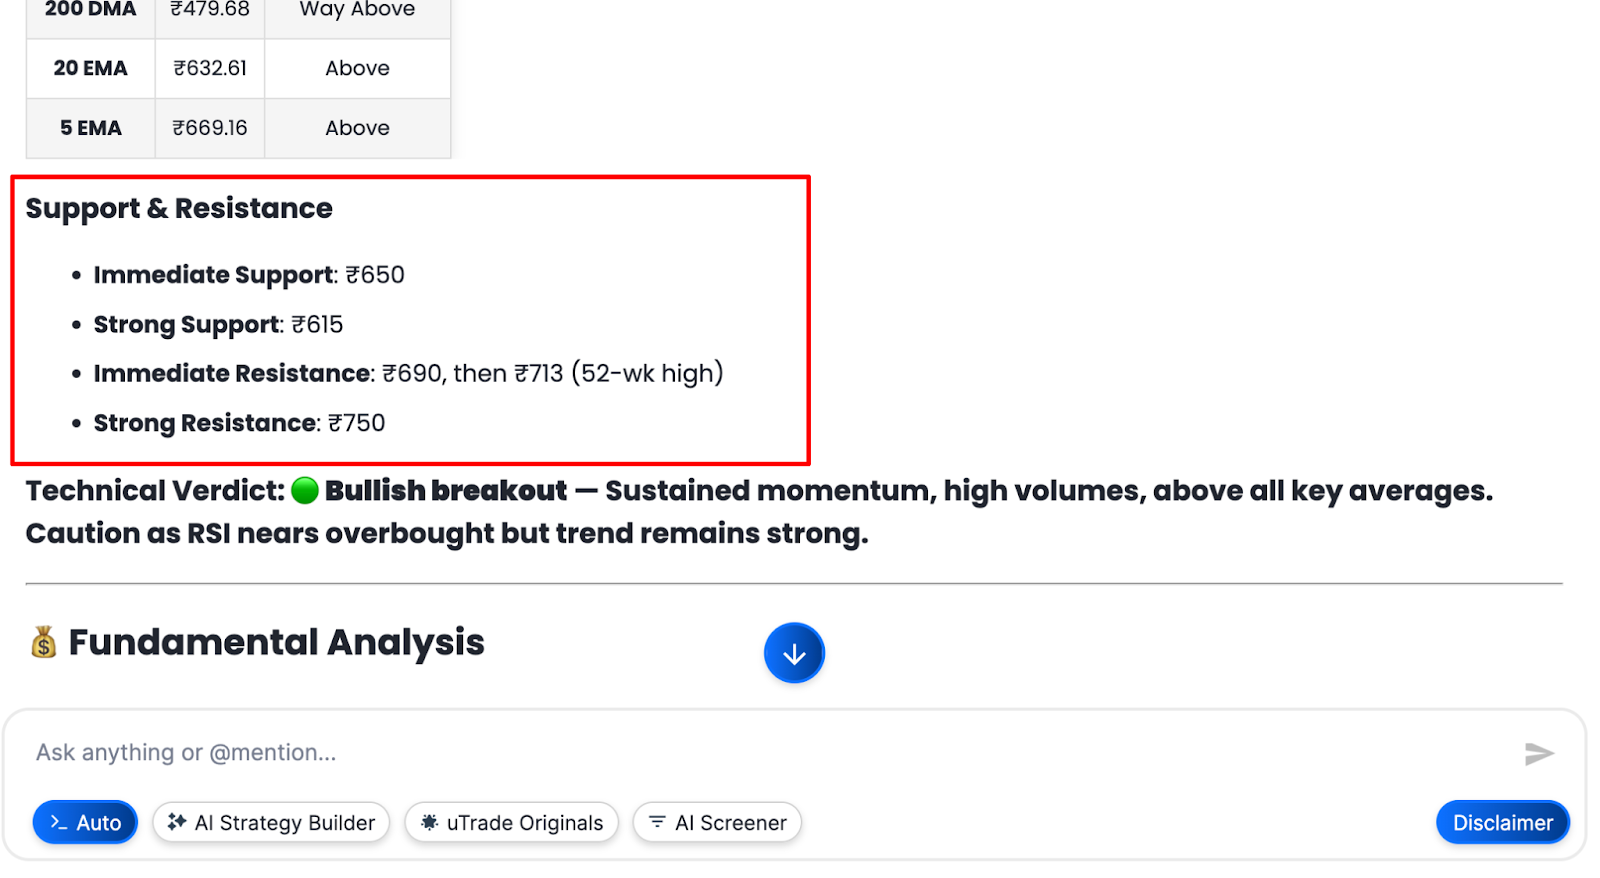
Here's what you understand from it:
- Support levels are those price levels at which the stock has historically shown signs of attracting buyers
- Resistance levels are those price levels at which the stock has historically shown signs of selling pressure
- How much more room does the stock have to go up or down before hitting a barrier
Technical analysis helps traders identify entry/exit timing, trend direction, and momentum conditions.
Fundamental Analysis
This section answers the core question: Is the company financially strong, and is the stock fairly valued? It is split into two parts:
Valuation Metrics:
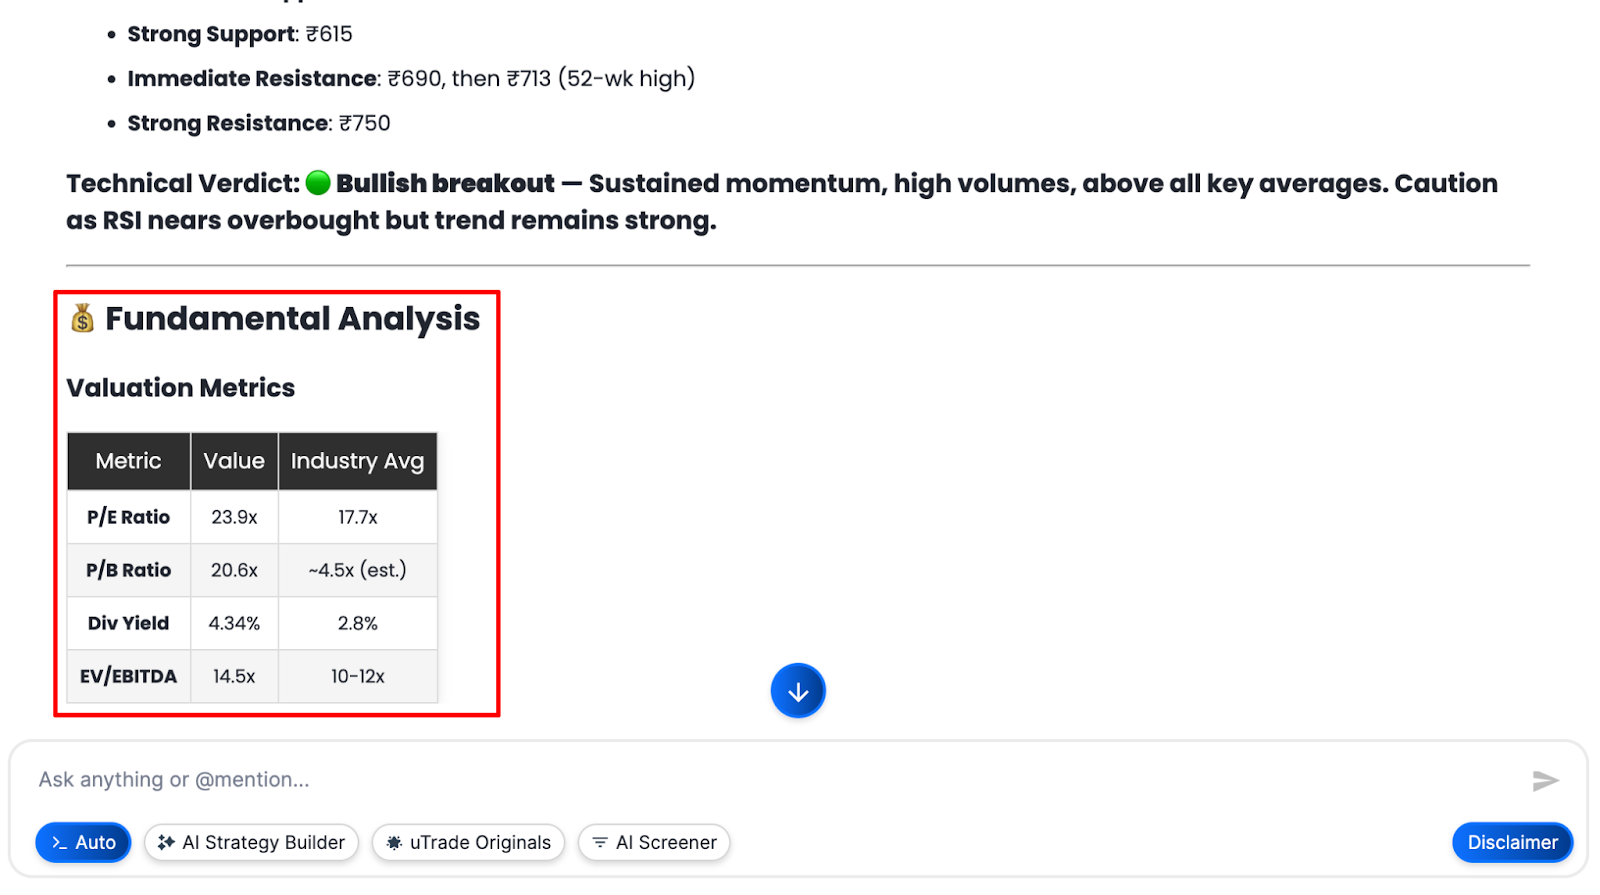
Here's what you understand from it:
- Are you paying a fair price for the stock compared to industry peers?
- Are you paying a high or low P/E ratio compared to industry peers, with an instant view of how the stock's P/E ratio compares to industry averages?
- Is the high P/E ratio justified by the performance of the company?
Profitability Metrics:
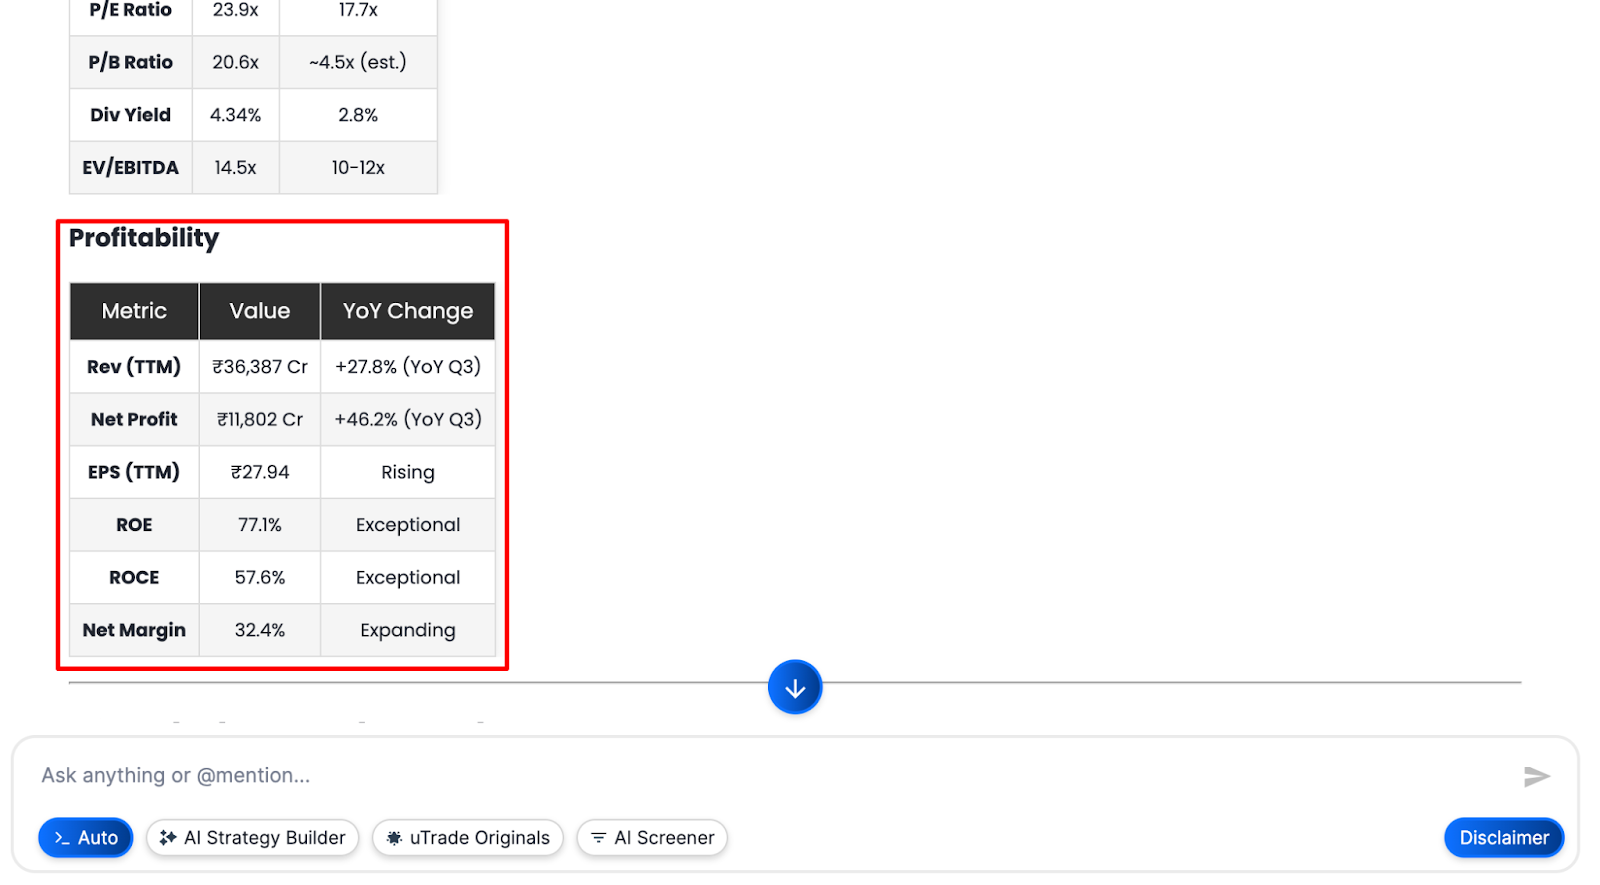
Here's what you understand from it:
- How has the company's revenue and net profits grown over the past year?
- What kind of margins is the company enjoying, which reflects how efficiently the business is being run?
- How efficiently is the company using the shareholders' money to generate profits?
Cash Flow & Balance Sheet
This section tells you about the financial health and stability of the company beyond just reported profits:

Here's what you understand from it:
- Actual cash generated from the operations of the company - a better health check than profits
- Debt levels - the level of debt the company is in, and whether the debt is good or bad debt
- Interest coverage - whether the company is comfortable paying off debts or not
- Overall balance sheet health - ensuring the company is in good financial health to withstand any downturn in the economy.
Strong cash flow and a healthy balance sheet indicate financial stability and the ability to weather economic downturns.
Corporate Events
This section keeps you informed about key company actions that could directly impact the stock price:
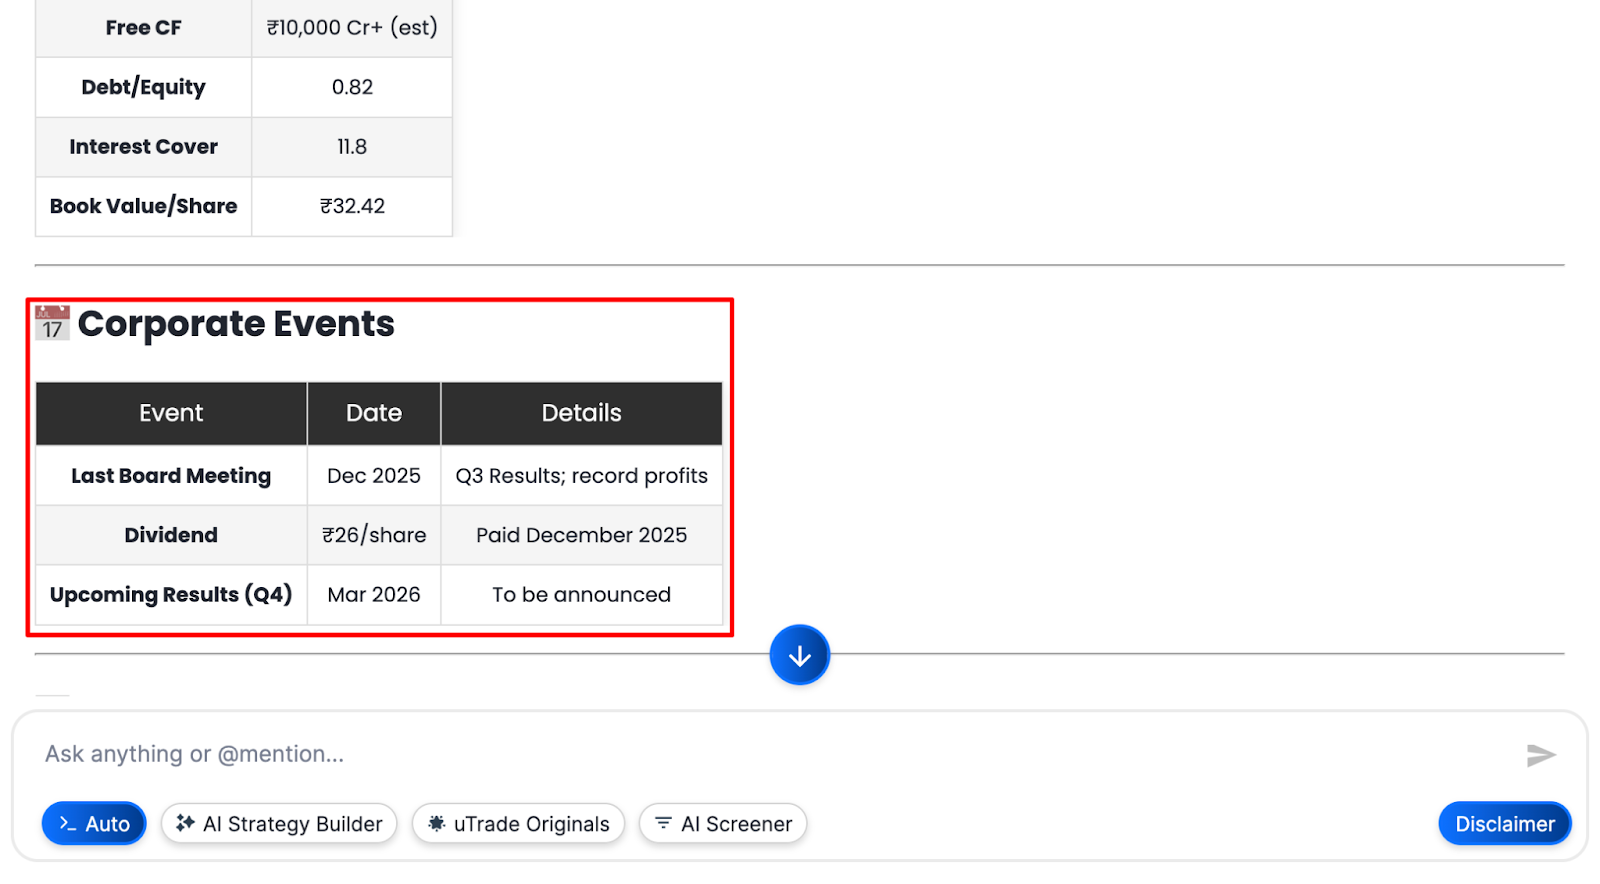
Here's what you understand from it:
- Upcoming result dates – so you know what the next major price catalyst is due
- Dividend announcements – recent or upcoming dividends that impact the attractiveness of the stock to income investors
- Board meetings, stock splits, or buybacks – events that often create major price movements
- Helps you make smarter timing decisions about when to enter or exit a particular stock.
Corporate events often create price movements that can be opportunities for investors.
Recent News & Developments
This section surfaces the most relevant recent news so you understand the story behind the numbers:
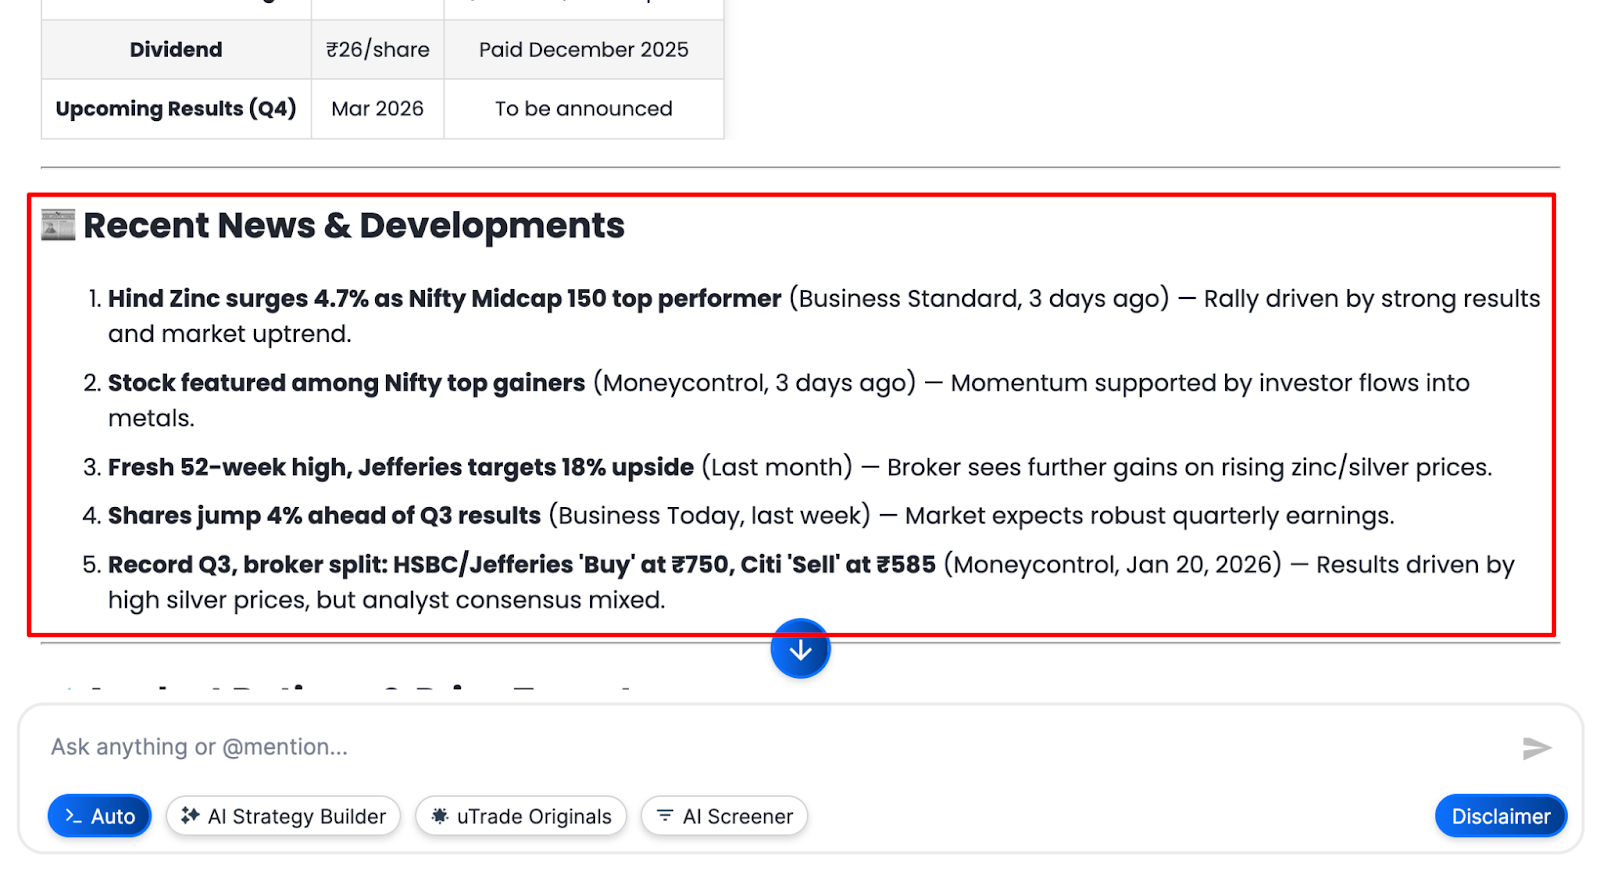
Here's what you understand from it:
- Why the stock moved recently — connecting price action to actual events
- Business developments — new contracts, partnerships, capacity expansions, or earnings reactions
- Analyst actions — recent upgrades, downgrades, or new coverage initiations
- Sector-level news — industry-wide developments that affect the company
- Emerging risks or opportunities — regulatory updates, management changes, or macro factors in play
News context helps understand recent price movements and emerging catalysts.
Analyst Ratings & Price Targets
This section gives you a snapshot of professional institutional opinion on the stock:
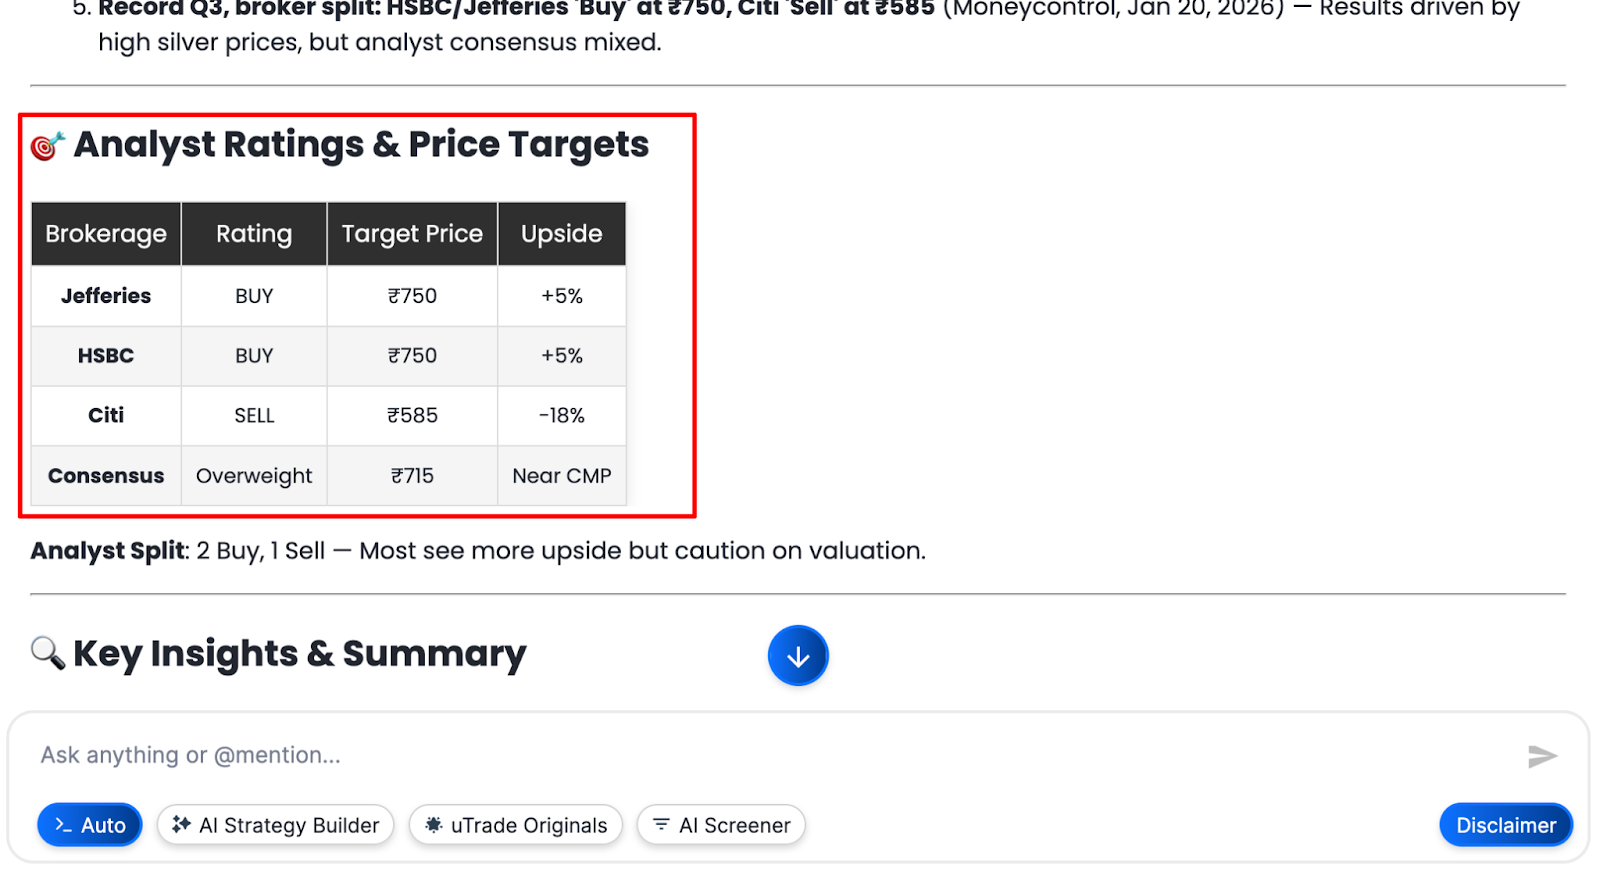
Here's what you understand from it:
- Individual brokerage ratings, such as Buy, Hold, or Sell recommendations from major research firms
- Price targets that indicate the price at which the stock is expected to trade, thus showing the percentage gain or loss from the current price
- Consensus view — the overall aggregated stance across all covering analysts
- A split between buy and sell ratings signals higher uncertainty; a strong consensus buy with upside to target can add conviction to your own positive view
Key Insights & Summary
This is the most important section — the AI synthesizes everything into a clear, structured, actionable summary:

Strengths
- Highlights what is working in favor of the stock. This could be strong financials, technicals, news sentiment, or sector performance.
Concerns
- Flags the concerns that one must be aware of. This could be high valuations, deteriorating technicals, high debt levels, or negative analyst sentiment.
Investment Thesis
- Ties everything together in a concise paragraph
- Gives you an overall assessment — whether the stock looks attractive, needs more patience, or should be avoided based on current data
- Helps you walk away with a clear, data-backed perspective rather than information overload
This summary distills a comprehensive analysis into an actionable perspective.
Step 6: Analyze Additional Stocks
The beauty of uTrade AI Intelligence is speed and repeatability. After analyzing one stock, immediately request analysis of others:
Sequential Analysis:
- "Now analyze Tata Motors."
- "Show me a detailed analysis of ICICI Bank."
- "Analyze Reliance Industries next."
Each analysis takes less than 60 seconds, enabling comparisons among different candidates.
Comparative Analysis: Once you've analyzed a few stocks, you can ask for comparisons like this:
- "Compare Hindustan Zinc and Vedanta on fundamental analysis."
- "Which stock is more attractive from the point of view of value investing, Tata Motors or Mahindra & Mahindra?"
- "Compare the technicals of ICICI Bank and HDFC Bank."
This iterative AI stock market analysis workflow enables efficient portfolio construction and opportunity evaluation.
Suggested Reading:
How to Deploy Your First AI Algo with uTrade AI Strategy Builder
Conclusion
The days of spending weekends drowning in financial statements and technical charts are finished. uTrade AI Stock Analysis compresses exhaustive research into conversational seconds, delivering professional-grade evaluation through simple English queries.
You've learned the complete workflow—from initial screening to comprehensive analysis covering fundamentals, technicals, news, events, and investment thesis.
This AI stock analysis tool within uTrade Intelligence doesn't just save time; it democratizes access to institutional-quality research previously available only to professionals. Your next investment opportunity awaits analysis. Ask the AI, review the insights, and make informed decisions with data that took hours to compile in the past.
Frequently Asked Questions
How current is the data used in uTrade AI stock analysis?
uTrade AI's stock analysis is based on real-time data such as prices, volume, and technical indicator data during trading hours. Fundamental data like financials and ratios is available as companies announce their quarterly results. News and events are based on the latest information available in the public domain.
Can I analyze stocks from international markets or only Indian stocks?
uTrade AI Stock Analysis primarily covers stocks listed on Indian exchanges (NSE and BSE). For comprehensive fundamental analysis, technical indicators, and corporate events, Indian equities are the focus. International stock analysis may be limited or unavailable depending on platform development.
Does AI stock analysis provide buy/sell recommendations?
Although the AI analysis offers in-depth data analysis, technical analysis, fundamental analysis, and investment thesis where the strengths of the company have been pointed out along with the weaknesses, no specific recommendations to buy or sell the stocks are made. It is your responsibility to make the necessary investment decisions based on your personal risk level and goals.
How accurate are the analyst ratings and price targets shown?
Although the ratings and target prices provided by the AI analysis represent the professional consensus of the analysts who cover the particular stock, the accuracy of the ratings cannot be guaranteed. Analyst ratings can sometimes be wrong.
Can I export or save AI stock analysis for future reference?
Although the AI analysis provided by the uTrade Intelligence is available only in the conversation window, for record purposes, the sections of the analysis can be copied to another document or a record kept in the investment journal where the relevant findings of the analysis have been noted.
.avif)
.avif)
.avif)
.avif)
.avif)
.avif)
.avif)


