
.avif)
Introduction
Trading in India has become more accessible than ever, but one problem still remains the same—confusion about when to buy and when to sell. Many traders spend hours watching charts, trying to understand signals, and still end up making emotional decisions.
This is where Indicator-Based Algo Trading makes things easier.
Indicator-Based Algo Trading is a method where a computer system automatically takes buy and sell decisions for you based on simple rules created using indicators like RSI, MACD, or Moving Averages. Platforms like uTrade Algos allow you to set these rules without coding or technical complexity.
In simple words, instead of constantly thinking “ab entry loon ya wait karu?”, you define your rules once—and the system follows them without hesitation.
What is Indicator-Based Algo Trading?
Indicator-Based Algo Trading is a method where trading decisions like buy and sell are automatically taken using technical indicators instead of manual judgment or emotions.
Think about driving on a road with traffic signals.
You don’t decide randomly when to stop or go.
Instead:
- Red light = Stop
- Green light = Go
- Yellow light = Wait and prepare
You simply follow the rule system that is already set.
Now relate this to trading:
- Indicators = traffic signals
- Trading strategy = traffic rules
- Algo system = automatic traffic controller
You don’t guess what to do at the signal—the system already tells you clearly.
In the same way, indicator-based algo trading removes confusion and tells you exactly when to enter or exit a trade.
Suggested read:
What Is Indicator-Based Algo Trading and How Does It Work?
Why are indicators important in trading?
- Indicators help you understand market direction because they analyze price trends and show whether the market is moving up, down, or sideways
- They reduce guesswork because signals are based on past data and calculations, not emotions or assumptions
- Indicators help identify the right entry and exit points because they give specific conditions (like crossover or levels) where action should be taken
- They show whether the market is overbought or oversold because they measure how far price has moved from its average (like RSI)
- Indicators help measure momentum because they track how fast price is moving, which shows whether a trend is strong or weak
- They help traders avoid emotional decisions because rules are already defined, so there is no need to react based on fear or greed
- Indicators make trading more structured because they turn random decisions into clear, repeatable rules
- They allow strategies to be automated because indicators can be converted into fixed conditions that a system can follow
- Indicators help filter out weak or false signals because combining multiple indicators confirms whether a trade is valid
- They improve consistency because the same rules are followed every time, unlike manual trading where decisions may change
How to Get Started with Indicator-Based Algo Trading
Getting started is simpler than most beginners think.
Step 1: Choose a Platform
Select a platform like uTrade Algos that supports indicator-based strategies without coding.
Step 2: Strategy Builder
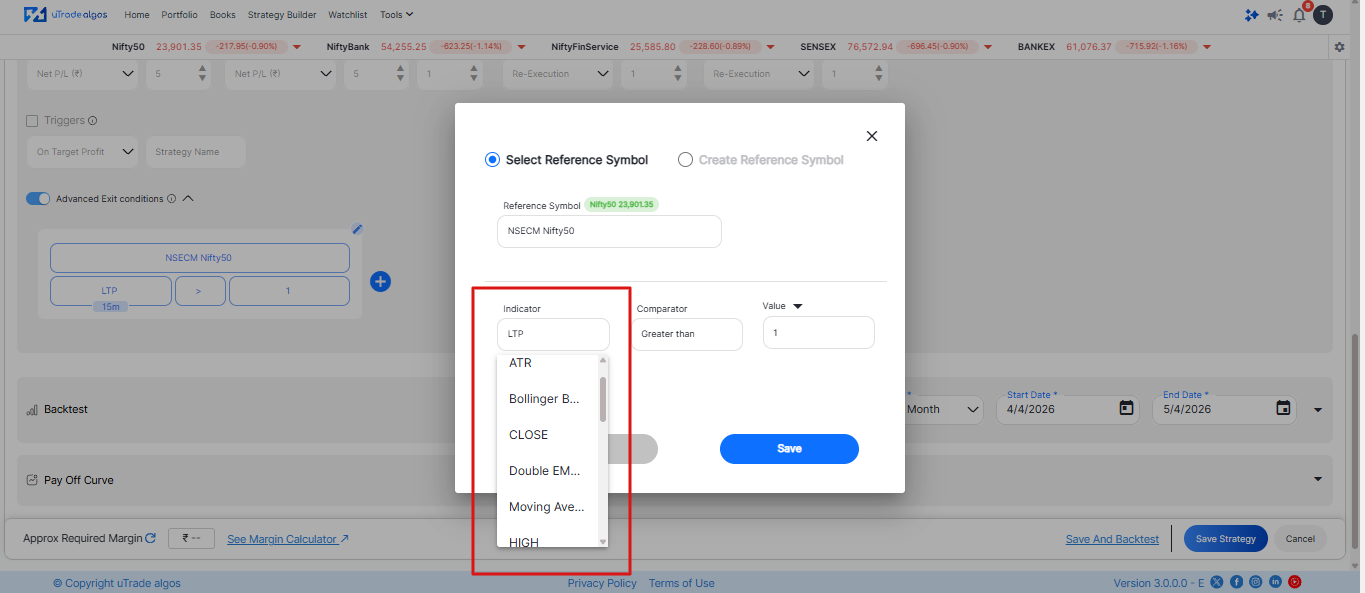
Click on Strategy Builder and go to Leg Settings → Advanced Leg Settings
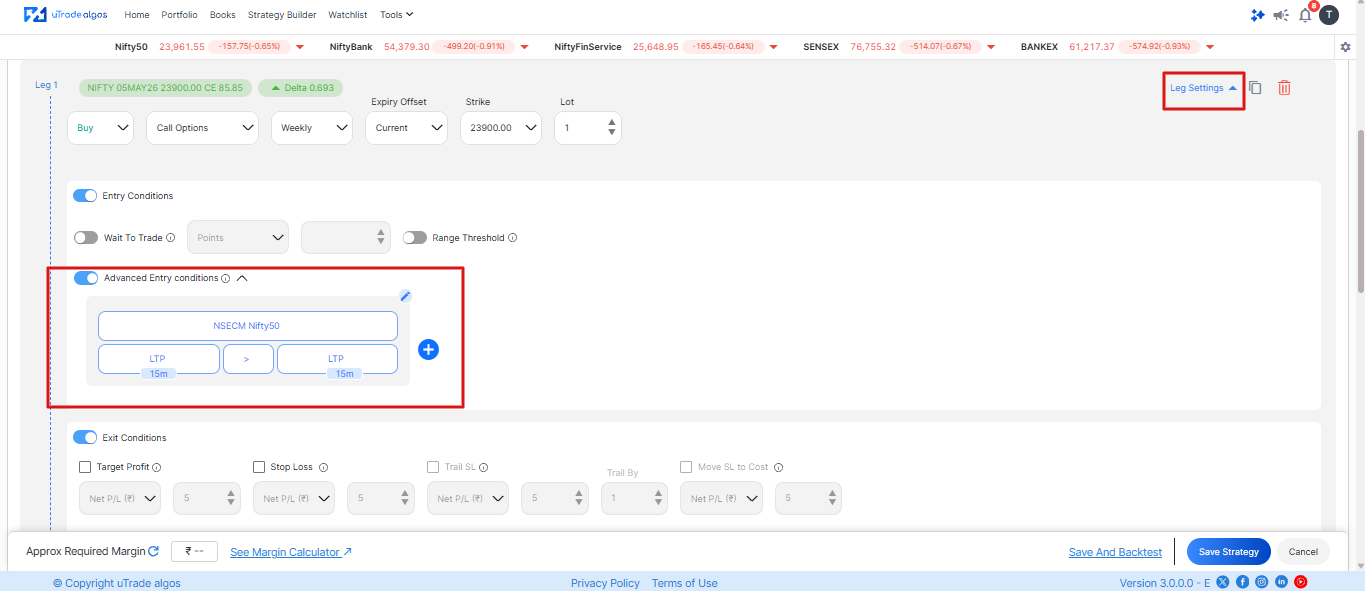
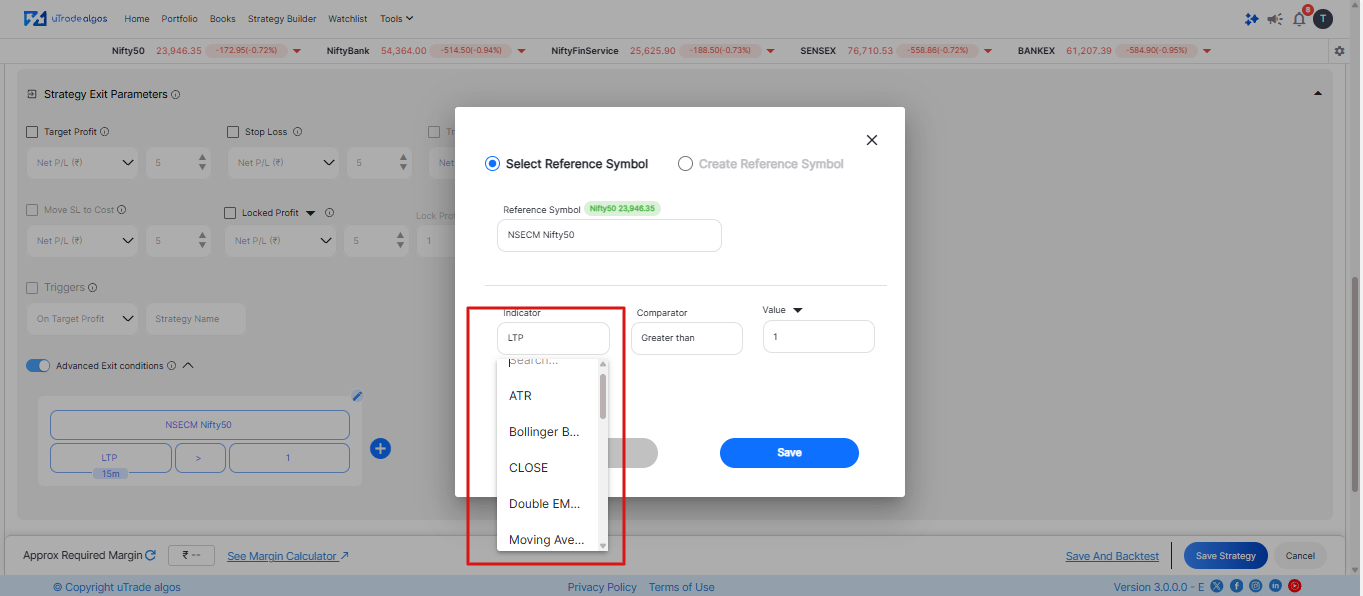
Step 3: Select Indicators
Choose basic indicators like:
- Moving Averages (trend)
- RSI (overbought/oversold)
- Volume or MACD (confirmation)
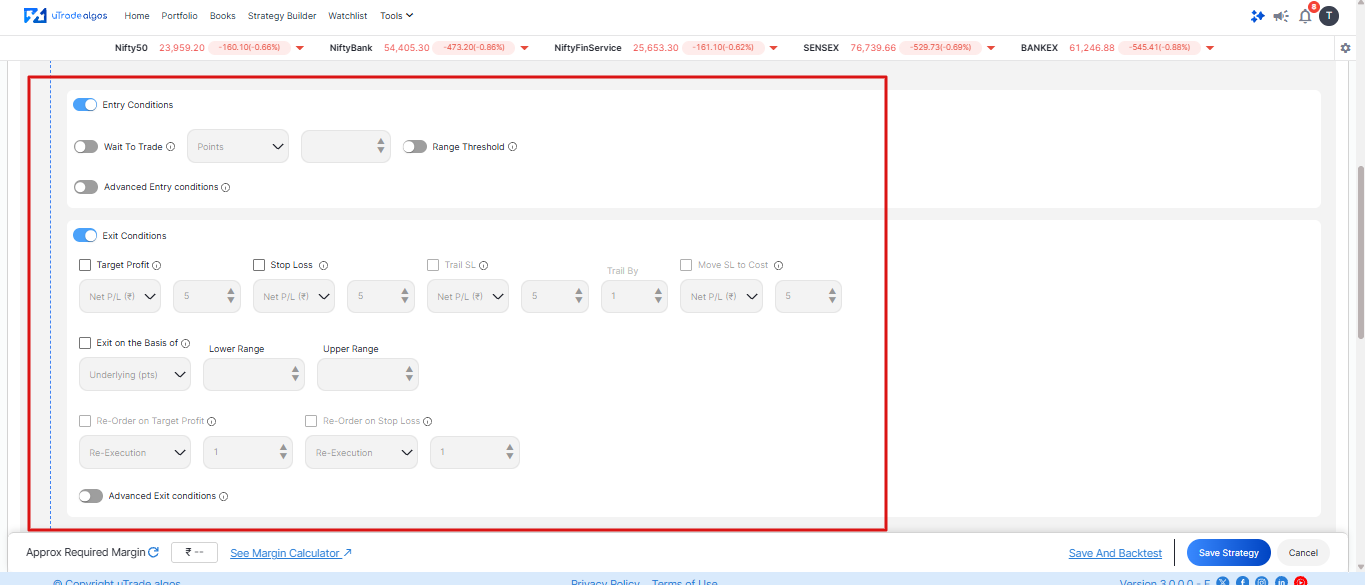
Step 4: Define Rules
Set simple conditions:
- When to buy
- When to sell
- Stop-loss and target
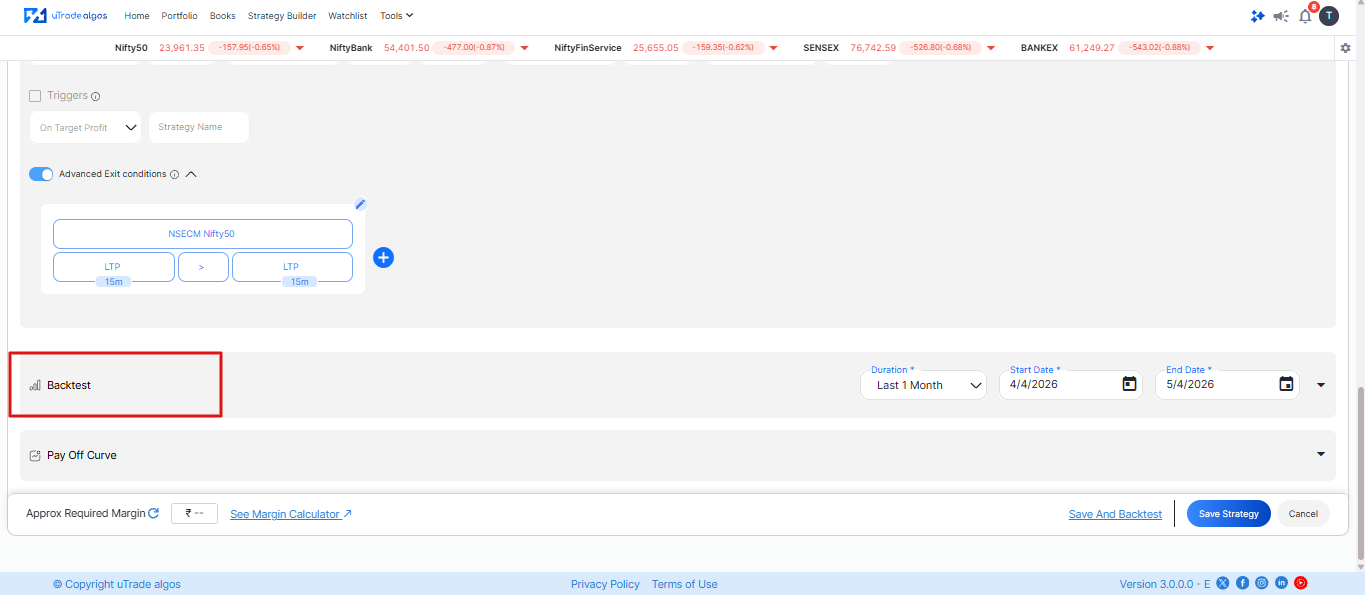
Step 5: Backtest the Strategy
Check how your strategy would have performed in past market conditions.
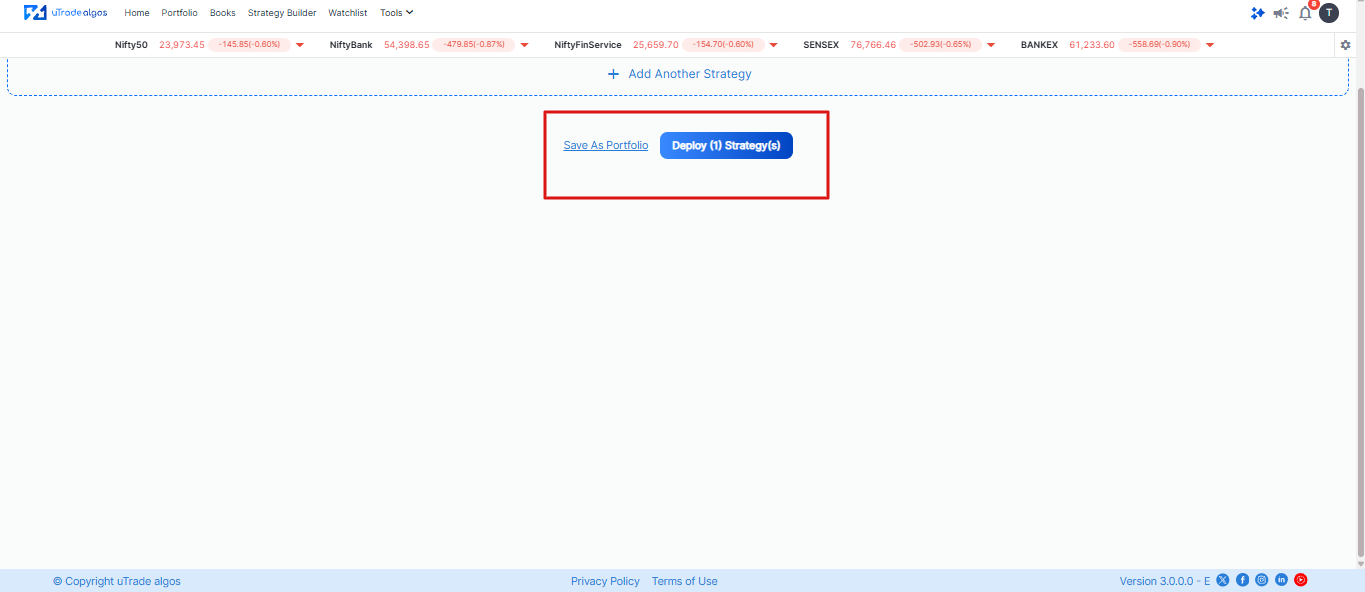
Step 6: Save and Deploy the Strategy
Why This Method Works for Many Traders
The biggest advantage of indicator-based algo trading is structure.
Most trading mistakes happen not because of bad analysis, but because of:
- Late entry decisions
- Emotional exits
- Overthinking during volatility
- Not following a fixed plan
By turning indicators into fixed rules, the system removes these human delays.
This is why modern platforms like uTrade Algos focus on:
- Prebuilt strategies for beginners
- AI-assisted strategy creation
- Template-based strategy building without coding
- Easy customization using indicators instead of programming
The goal is simple — reduce complexity and help traders focus on strategy, not execution stress.
Indicators Available on uTrade Algos (Quick Overview)
uTrade Algos provides a wide range of technical indicators to help traders build smart, rule-based strategies without complex coding. Here’s a quick one-line introduction to each:
- ATR (Average True Range): Measures market volatility by showing how much price moves on average.
- Bollinger Bands: Shows price volatility with upper and lower bands around a moving average.
- Close Price: The final price at which a candle closes.
- DEMA (Double Exponential Moving Average): A faster moving average that reduces lag compared to EMA.
- Exponential Moving Average (EMA): A moving average that gives more weight to recent prices.
- High Price: The highest price reached during a candle.
- Low Price: The lowest price reached during a candle.
- LTP (Last Traded Price): The most recent price at which a trade occurred.
- MACD Histogram: Shows the difference between MACD line and signal line to indicate momentum strength.
- MACD Line: Tracks the difference between two EMAs to identify trend direction.
- MACD Signal Line: A smoothed line used to generate buy/sell signals with MACD.
- Open Price: The price at which a candle starts.
- RSI (Relative Strength Index): Measures whether a stock is overbought or oversold.
- Simple Moving Average (SMA): The average price over a specific time period.
- Supertrend Indicator: Helps identify the current market trend (uptrend or downtrend).
- TEMA (Triple Exponential Moving Average): An advanced moving average that further reduces lag.
- Volume of Candle: Shows the total number of shares/contracts traded in a candle.
- VWAP (Volume Weighted Average Price): The average price weighted by volume, often used by intraday traders.
- Weighted Moving Average (WMA): A moving average that assigns different weights to prices.
More indicators and advanced strategy concepts coming soon…
Conclusion
Indicator-Based Algo Trading makes trading more structured by turning simple market indicators into clear, rule-based decisions. Instead of manually watching charts or reacting emotionally, traders define conditions once and let the system handle execution.
The real value of this approach is not in predicting the market, but in improving discipline, consistency, and execution speed. Whether a trader chooses a prebuilt strategy, an AI-generated setup, or a template-based system, the foundation remains the same—indicators guide the logic, and automation removes hesitation.
Platforms like uTrade Algos simplify this entire process by allowing traders to build and run strategies without coding, making systematic trading more accessible to both beginners and experienced traders.
At its core, this approach helps traders shift from reactive decision-making to a more planned and rule-driven style of trading.
Frequently Asked Questions (FAQs)
Do I need to understand technical indicators deeply to start indicator-based algo trading?
No. Most platforms provide ready-made indicators and templates, so beginners can start by simply selecting conditions without needing deep technical knowledge.
Can I modify a strategy after it has started running?
Yes. In most modern algo platforms, strategies can be paused, edited, and restarted. Some systems even allow live adjustments depending on market conditions.
What happens if market conditions suddenly change after my strategy is live?
The system will continue following the defined rules. This is why traders usually add multiple indicators or filters to avoid weak or false signals during volatile conditions.
Is indicator-based trading only useful for intraday trading?
No. It can be used for intraday, swing trading, and even longer-term strategies depending on how indicators and timeframes are configured.
How do traders know if their indicator-based strategy is actually reliable?
Reliability is usually checked through backtesting and forward testing, where the strategy is tested on past and live market data before full deployment.
Can two traders using the same indicators get different results?
Yes. Results depend on how rules are defined, how indicators are combined, and how risk management is set. Even small changes in logic can lead to different outcomes.
.avif)
.avif)
.avif)
.avif)
.avif)
.avif)
.avif)


