
.avif)
Introduction
One of the biggest differences between a random trader and a consistent trader is this:
One reacts to the market. The other prepares for it.
The Payoff Curve in trading is one of those tools that helps you prepare in advance. In simple terms, it shows exactly how much you can gain or lose at different price levels before you take a trade and platforms like uTrade Algos make this understanding much easier for everyday traders.
But instead of jumping straight into definitions, let’s look at something more real.
What is a Payoff Curve?
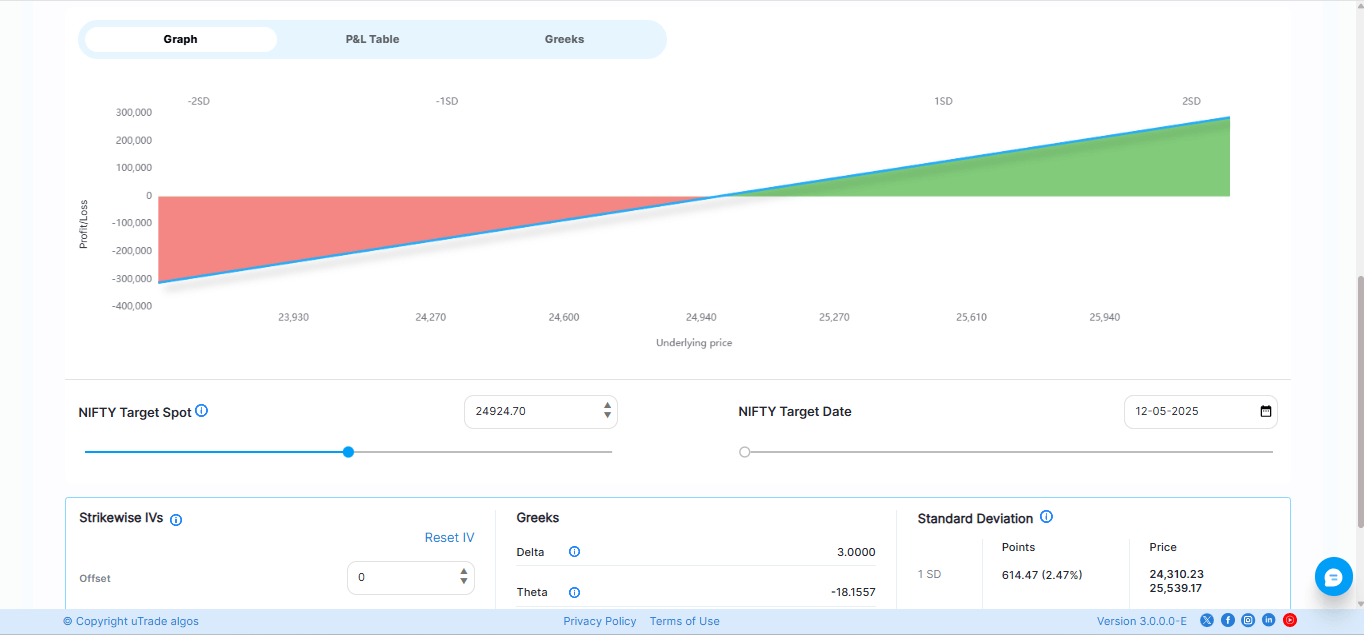
A payoff curve (also called a profit and loss diagram, or P&L graph) is a graphical representation of the potential outcomes of a trade. The horizontal axis represents the price of the underlying asset — say, Nifty 50. The vertical axis represents the profit or loss at that price level on the expiry date.
The curve plots every possible scenario: what happens if Nifty closes at 22,000? What if it closes at 23,500? What if it crashes to 21,000? All of these outcomes are visible in one single graph before you ever place the trade.
"A trade without a payoff curve is like driving in the dark without headlights. You might reach your destination, but you are taking an unnecessary risk."
For options traders especially, the payoff curve is non-negotiable. Unlike equity trading where your profit or loss is fairly linear — buy low, sell high — options strategies can create complex, non-linear payoff structures. The payoff curve makes this complexity visible and manageable.
Why Does the Payoff Curve Matter in Trading?
Many traders focus only on entry—“Where should I buy?” or “Where should I sell?”
But experienced traders focus on something else entirely—“What happens after I enter?”
This shift in thinking is what separates random trading from structured trading.
A payoff curve helps you see your maximum loss before you even place the trade. This alone can save you from major drawdowns. Instead of reacting emotionally when the market moves, you already know what to expect.
It also improves your decision-making. Instead of asking whether a trade “feels right,” you can evaluate whether the risk-reward actually makes sense.
For example, if you’re risking ₹5,000 to make ₹1,000, is it really worth it? A payoff curve answers that instantly.
Suggested Reading:
The Psychology Behind Payoff Curves: Understanding Trader Behaviour
1. It Eliminates Guesswork
A payoff curve gives you a complete, data-backed view of how your trade will behave across different market movements.
Example:
You’re entering a trade when Nifty is at 22,000. Instead of guessing outcomes, the payoff curve shows you:
- What happens if Nifty goes to 22,200
- What happens if it stays around 22,000
- What happens if it drops to 21,500
Every possible scenario is already visible.
How it helps traders:
You’re not relying on assumptions or “hope.” You enter the trade with full clarity of outcomes, which removes uncertainty from your planning process.
2. It Shows Your Real Risk
A payoff curve reveals your actual maximum loss and exposure, not just the level where you plan to exit.
Example:
You sell a Nifty Call and collect ₹8,000 premium.
On the surface, it looks like a good trade. But if the market suddenly rallies 500–600 points:
- Your loss can expand to ₹40,000 or more
- And it can happen very quickly
The payoff curve would have shown this entire risk upfront.
How it helps traders:
You can evaluate whether the risk is acceptable before entering. This allows you to adjust the trade—by hedging, reducing quantity, or choosing a safer strategy—based on actual exposure.
Suggested Reading:What are the Different Types of Payoff Diagrams?
3. It Helps You Choose the Right Strategy
A payoff curve lets you compare different strategies visually so you can select the one that aligns with your market view and risk appetite.
Example:
You’re bullish on Nifty and considering:
- Buying a Call option
- Using a Bull Call Spread
When you compare payoff curves:
- Call → Higher upside but higher cost and faster time decay
- Spread → Limited profit, lower cost, more stable performance
How it helps traders:
Instead of choosing based on profit potential alone, you make a structured decision based on how each strategy behaves in real market conditions.
4. It Keeps Your Decisions Practical — Not Emotional
A payoff curve gives you a structured reference for your trade, so your decisions are based on data, not short-term P&L movement.
Example:
You enter a trade and see a ₹2,000 loss.
Without context, this feels risky and may trigger an early exit.
But when you’ve already seen the payoff curve, you know:
- This loss falls within the expected range
- Your actual risk begins beyond a certain level
- The trade structure is still valid
How it helps traders:
Instead of reacting to every price movement, you rely on the predefined structure of the trade. This keeps your decisions aligned with market logic and prevents impulsive exits or overreactions.
5. It Makes Complex Strategies Easy to Understand
A payoff curve simplifies multi-leg strategies by combining all positions into one clear outcome.
Example:
In an Iron Condor, you are managing four positions at once:
- Sell Call
- Buy Call
- Sell Put
- Buy Put
Calculating combined outcomes mentally at every price level is not practical.
The payoff curve shows:
- Profit zone
- Loss zones
- Maximum profit and loss
- Break-even points
How it helps traders:
You get a complete understanding of the strategy in one view. This reduces confusion and allows you to execute and manage complex trades with clarity.
Suggested reading:
Why Payoff Curves Matter in Algorithmic Trading
Common Payoff Curve Shapes and What They Mean
The following are the common payoff curve shapes and their meanings:
Long Call — Unlimited Upside
The payoff curve rises sharply to the right when the market goes up and stays flat at the maximum loss level to the left. This is the classic asymmetric payoff that attracts many traders to options buying.
.avif)
Short Call — Unlimited Risk
The mirror image of a long call — capped profit if the market stays flat or falls, but unlimited loss if the market rallies strongly. This is why naked short positions are dangerous without proper risk management.
.avif)
Iron Condor — Defined Risk on Both Sides
The payoff curve looks like a plateau — flat profit in the middle as long as the market stays in a range, and defined, capped losses on both sides. This is one of the most popular strategies for rangebound markets in India, especially before major events like Budget day or FOMC meetings.
.avif)
Long Straddle — Profit in High Volatility
The payoff curve is V-shaped, showing profit when the market moves significantly in either direction. Traders use this before high-impact events like RBI policy announcements, election results, or major earnings.
.avif)
Suggested Reading:
Option Payoff Diagrams: How to Read, Analyze & Use Payoff Curves for Smarter Options Trading
How uTrade Algos Makes Payoff Curves Accessible to Every Trader
Understanding payoff curves conceptually is one thing. Actually being able to visualise them for your specific trade — in real time, with live market data — is another.
This is where uTrade Algos genuinely stands out as a platform built for the Indian retail trader.
uTrade Algos is an AI-powered algorithmic trading platform that brings institutional-level tools to everyday traders — whether you are a complete beginner or an experienced options trader.
Visual Strategy Builder with Live Payoff Diagrams
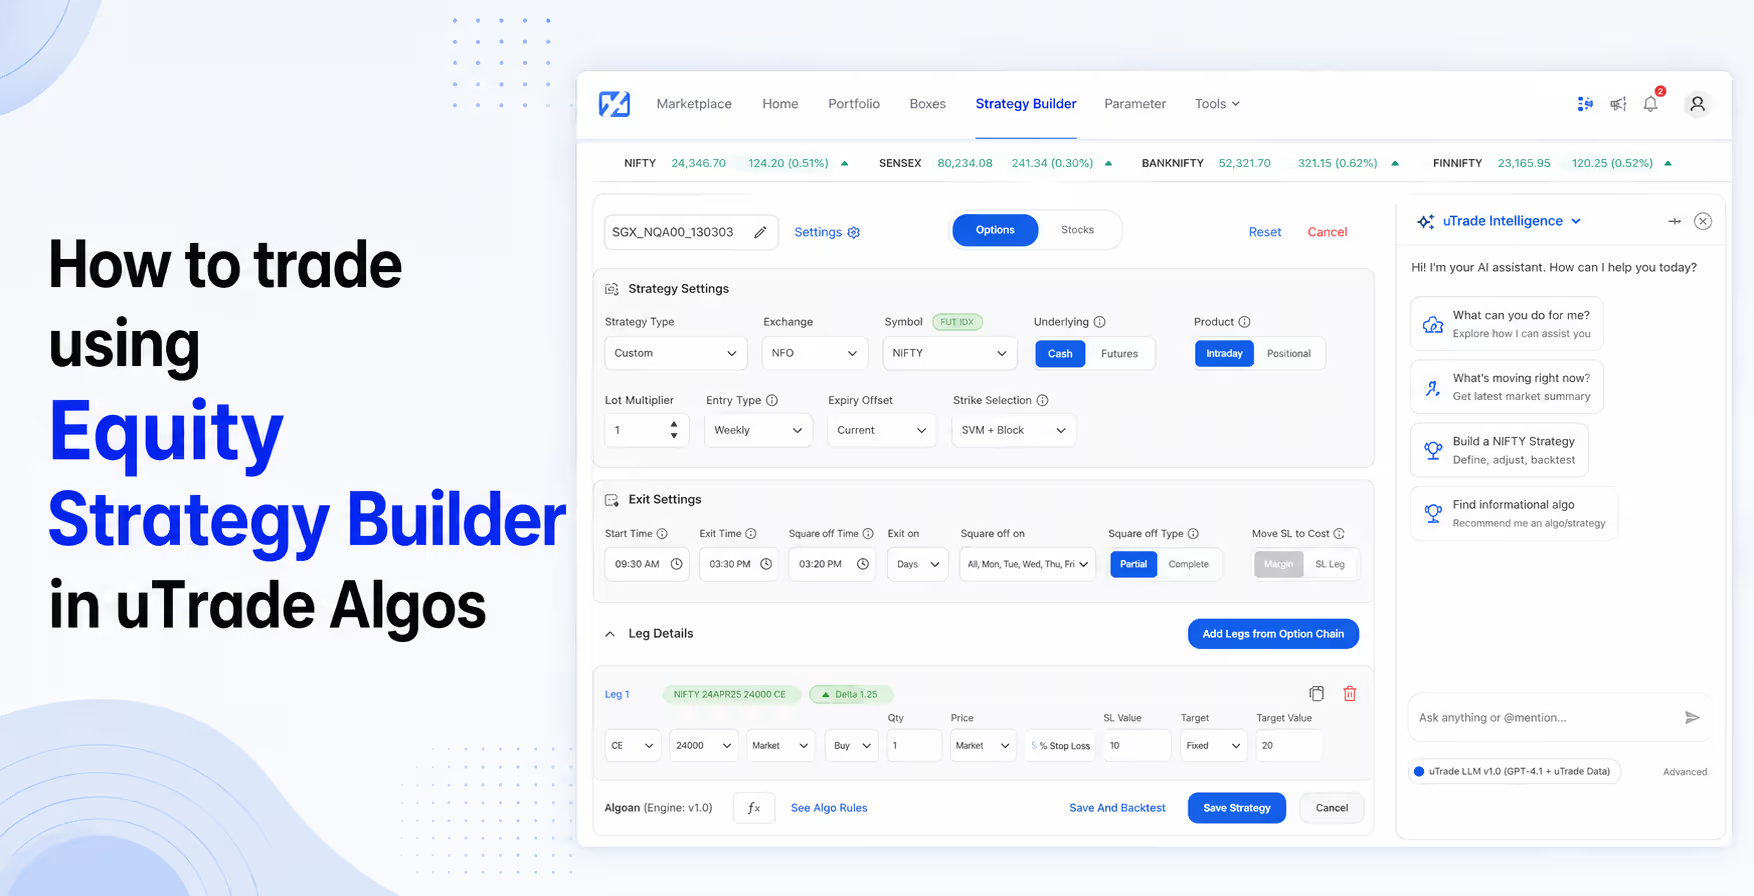
uTrade Algos features an intuitive strategy creation tool that automatically generates a payoff curve as you build your strategy. Whether you are creating a simple Bull Call Spread or a complex multi-leg position, you see the risk-reward picture update in real time as you add each leg.
Pre-Built Strategies with Ready Payoff Views
Not sure where to start? uTrade Algos offers a library of pre-built strategies — from straightforward positions to advanced spreads — each with its payoff curve readily viewable. This is especially helpful for traders who are still learning strategy design.
uTrade Intelligence — AI-Powered Insights
The platform's AI-powered module, uTrade Intelligence, goes beyond just showing you the payoff curve. It provides insights on market conditions, strategy suitability, and potential risks — helping you make more informed decisions rather than relying on tips or gut feel.
If you are trading Nifty or Bank Nifty options and want to understand your real risk before every trade, exploring uTrade Algos is a meaningful step toward more disciplined, strategy-driven trading.
Common Mistakes Traders Make by Ignoring Payoff Curves
- Selling naked options without understanding the unlimited loss potential
- Entering multi-leg strategies based on someone else's tip without visualising the combined payoff
- Holding losing positions too long because there was no pre-defined exit plan
- Over-leveraging because the maximum loss scenario was never seen clearly
- Choosing a strategy based on maximum profit without considering how likely that scenario actually is
Each of these mistakes is avoidable. All it takes is the discipline to look at the payoff curve before placing the trade.
Conclusion
The market does not reward courage alone — it rewards preparation. In trading, preparation means knowing exactly what you stand to gain and what you stand to lose before you place a single order.
The payoff curve in trading is not a complex mathematical concept reserved for finance professionals. It is a practical, visual tool that every retail trader in India — from someone trading their first options contract in Jaipur to an experienced algo trader in Mumbai — can and should use.
Start with simple strategies. Visualise their payoff curves. Understand your breakeven points, your maximum loss, and your maximum profit. Make this a habit before every trade, and you will find yourself making calmer, more informed, and more disciplined decisions over time.
Consistent, sustainable trading is built on strategy and discipline — not luck. The payoff curve is one of the simplest tools to get you there.
Frequently Asked Questions (FAQs)
How do Indian traders use payoff curves in Nifty and Bank Nifty trading?
In India, payoff curves are widely used in index trading like Nifty and Bank Nifty to understand how strategies will perform at different levels. This is especially helpful during expiry days when volatility can change outcomes quickly.
What is the best way to analyse payoff curve for options trading in India?
The best way is to look at three things: maximum loss, break-even points, and profit zones. Indian traders often focus on whether the strategy suits a trending or sideways market before entering.
How to choose the right options strategy using a payoff curve?
You should match the payoff curve with your market view. For example, if you expect low movement, choose a strategy where the payoff shows profit in a narrow range.
Do I need software to create payoff curves in trading?
Not necessarily, but using tools makes it much easier and faster. Platforms like uTrade Algos allow you to visualize strategies instantly without manual calculations.
What is the difference between payoff curve and risk-reward ratio?
A risk-reward ratio gives you a basic idea of potential profit vs loss. A payoff curve goes deeper by showing how profit and loss change across different price levels.

.avif)



.svg)





