
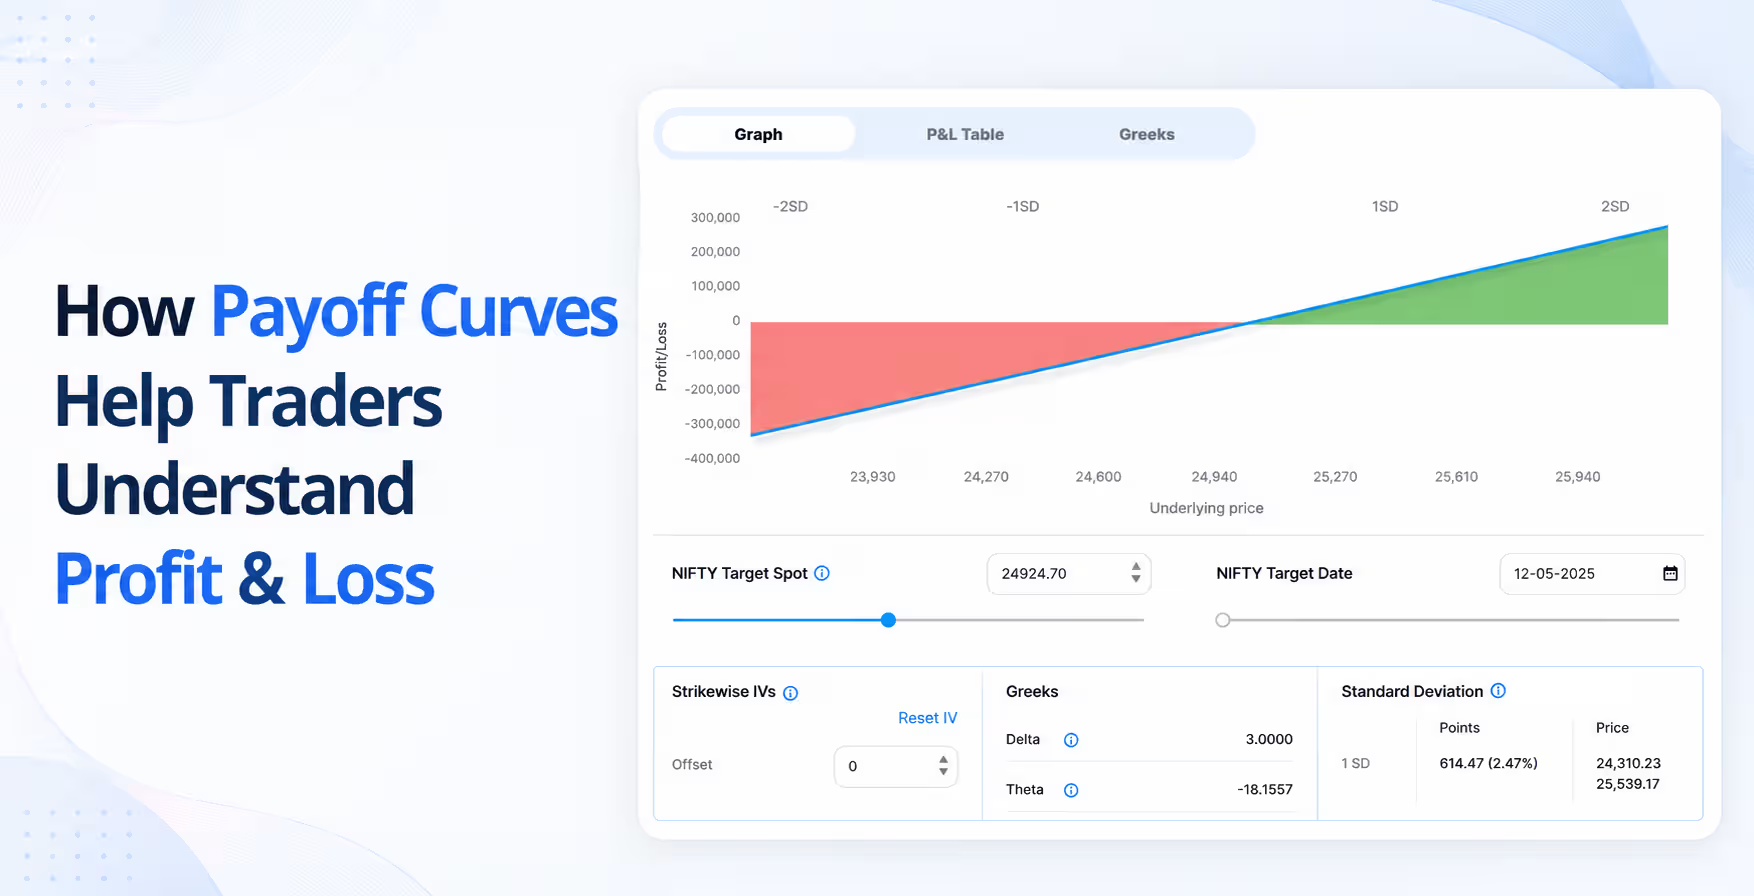
Introduction
Recent studies from the Securities and Exchange Board of India (SEBI) and industry analysts have confirmed that approximately 91% of individual retail traders in the equity derivatives (Futures and Options) segment in India reported losses in FY2025.
The bigger concern is that most of these traders are not even able to clearly understand why they are losing money or where their trades are going wrong.
Payoff Curves solve this problem by visually showing the complete Profit and Loss (P&L) structure of a trade even before it is executed, and platforms like uTrade Algos make this process simple, automated, and beginner-friendly by turning complex trading outcomes into easy-to-read visual charts.
Why Most Traders Struggle with P&L
Many Indian retail traders jump into trading after learning basic concepts like profit and loss formula or checking a profit and loss calculator. But real trading is very different.
In real markets:
- Prices move constantly
- Emotions take over
- Losses feel bigger than expected
This is where payoff curves come in.
Instead of guessing, payoff curves visually show you your potential profit and loss before you even enter a trade.
What Is a Payoff Curve?
A payoff curve — also called a payoff diagram or profit & loss graph — is a visual representation that maps out your potential profit or loss at every possible price of the underlying asset (like a stock or index) at the time your trade expires or closes.
The horizontal axis (X-axis) represents the price of the underlying asset — say, the Nifty 50 level or a stock's price. The vertical axis (Y-axis) shows your Profit and Loss (P&L) in rupees. The curve itself traces what happens to your money as the market moves from left (lower prices) to right (higher prices).
A payoff curve is a graph that shows:
How much profit or loss will you make?
At different price levels of a stock or option
Think of it like a map of your trade.
Instead of solving complex profit and loss problems or using profit loss excel formula, you just look at a graph and understand everything.
Suggested read: How Do Payoff Graphs Help in Decision-Making in Algorithmic Trading
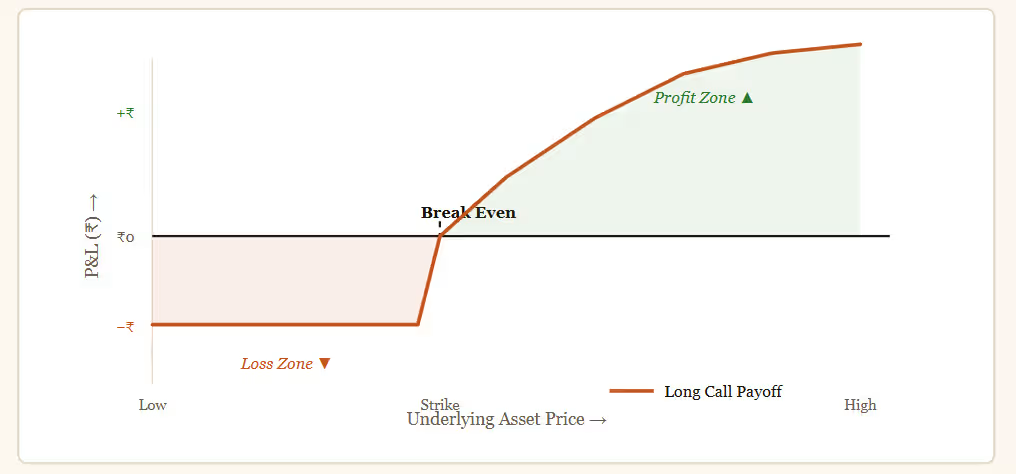
A simple payoff curve for a long call option — showing loss capped at the premium paid, and unlimited profit potential as price rises
In the diagram above, you can instantly see three things without doing any math:
The maximum loss is limited (the flat line at the bottom — your premium paid),
The break-even point is where the curve crosses zero,
The profit grows as the market moves in your favour.
This is exactly what a payoff curve communicates — at a glance.
Suggested Read: What are the Different Types of Payoff Diagrams?
Why Profit & Loss (P&L) Alone Is Not Enough
Many traders look at their P&L only after the trade is done — as a number on their screen. "Made ₹3,000 today" or "Lost ₹8,000 last week." But that single number tells you nothing about why it happened or whether your strategy was right or not.
A payoff curve, on the other hand, shows you the complete profit and loss format across all market scenarios — not just what happened, but what could happen at any price. This is particularly important for options traders, where a single trade can have a very different P&L depending on whether the market goes up, down, or sideways.
Suggested read:The Psychology Behind Payoff Curves: Understanding Trader Behaviour
The Three Things Every Payoff Curve Tells You
No matter how simple or complex your strategy is, every payoff curve answers three questions. These are the same three questions that every professional trader — from a retail trader in Mumbai to a fund manager in New York — asks before entering a position.
What is my maximum loss?
This is the lowest point of the curve — the floor of your downside. For an options buyer, this is always limited to the premium paid. Knowing your maximum loss in advance means you have already decided what you are comfortable risking. This is the core of responsible trading.
Where is my break-even point?
This is where the payoff curve crosses the zero line. At this price, your P&L is exactly ₹0. Many traders are surprised to discover that their break-even is much further from the current market price than they assumed. The payoff curve makes this impossible to miss.
Suggested read:
Why Payoff Curves Matter in Algorithmic Trading
Where does my trade start making money?
Everything above the zero line, beyond the break-even, is your profit zone. The curve shows you exactly how much money you make at each price level — and whether your upside is unlimited or capped.
These three answers — maximum loss, break-even, profit zone — give you the complete picture of any trade's risk and reward. And now that you know what to look for, let us see these three things in action with a real example.
Suggested read:
What are the Different Types of Payoff Diagrams?
What Are Payoff Curves and Why Do They Matter?
In simple terms, a Payoff Curve is a visual graph that shows how much profit or loss (P&L) a trade can make at different price levels of an asset.
Instead of solving complicated profit and loss problems, using profit loss excel formulas, or checking numbers manually, traders can simply look at a curve and understand:
- Where they will make profit
- Where they will make loss
- What is the maximum risk
- What is the maximum reward
- Where the break-even point lies
This visual clarity is what makes payoff curves extremely powerful, especially in fast-moving markets.
Think of it like a “map” of your trade before you even start the journey.
Suggested read:
Top 7 Key Elements of Effective Payoff Graph Analysis for Algo Traders
How This Changes the Way You Trade
Most traders think about P&L only after the trade, as a number on their screen at the end of the day. But that number is the result of a decision you already made. The payoff curve shifts your focus to before the decision — which is where it actually matters.
When you study the payoff curve before entering a trade, three key things happen:
You stop guessing
Instead of hoping a trade will work, you clearly understand what needs to happen in the market for you to make money. The break-even point, profit zone, and loss zone are all visible in advance, so your decision becomes informed rather than speculative.
You control your emotions
In live trading, even small market movements can create panic or overconfidence. But when you already know your payoff curve, you understand whether those movements are within your acceptable risk range. This helps you stay calm and stick to logic instead of reacting emotionally.
You manage risk properly
If the payoff curve shows a maximum loss of ₹20,000 but you are only comfortable risking ₹10,000, you can adjust the trade before entering it. You can reduce quantity, change strike price, or modify the strategy. This ensures risk management happens before the trade, not after the loss.
In options trading, there is a widely shared saying: “A trader who knows their worst case before entering a trade will always outlast one who discovers it after.”
Why Payoff Curves Are So Important for Traders
1. They Show Risk Before You Trade
Most beginners only think about profit. But experienced traders first check risk.
Payoff curves clearly show:
- Maximum possible loss
- Maximum possible profit
- Break-even points
This helps traders avoid blind entries.
2. They Reduce Emotional Trading
One of the biggest reasons for losses in India’s trading community is emotional decision-making.
Traders:
- Exit too early in profit
- Hold losing trades too long
- Panic during volatility
A payoff curve removes uncertainty by showing the full picture in advance.
3. They Make Options Trading Easy
Options trading can be confusing because outcomes are non-linear.
Strategies like:
- Buying options
- Selling options
- Spreads
- Iron Condors
All have different payoff structures.
Without payoff curves, it is almost impossible to understand these strategies properly—even if someone understands basic profit and loss calculations or formulas.
4. They Are Better Than Manual Calculations
Traditional methods like:
- profit and loss formula pdf
- profit and loss calculator
- profit & loss statements
They are useful in theory but not in real-time trading.
Payoff curves:
- Update visually
- Show dynamic risk
- Help in instant decision-making
Portfolio-Level Payoff Curves
Advanced traders don’t trade just one strategy—they manage multiple positions.
Portfolio payoff curves help in:
- Combining multiple trades
- Understanding overall risk
- Balancing strategies
This is similar to a payoff matrix, but much more visual and practical.
It is especially useful for algo traders and strategy builders.
Common Mistakes Traders Make Without Payoff Curves
1. Not Understanding Risk Properly: Many traders focus only on the profit side.
2. Ignoring Break-Even Points: They don’t know where losses actually start.
3. Overtrading: Without clarity, traders take unnecessary positions.
4. Relying Only on Theory: Like profit and loss short tricks instead of real-time tools.
Conclusion
\We started with one question: "If the market goes this way, how much do I make — and if it goes the other way, how much do I lose?" A payoff curve answers that question completely, for every possible market outcome, before you risk a single rupee.
It tells you your maximum loss — so you know the worst case upfront. It tells you your break-even point, so you know how far the market needs to move just to recover your cost. And it shows you your profit zone — so you can judge whether the potential reward justifies the risk you are taking.
These are not advanced concepts. They are the basic questions that every disciplined trader asks — and the payoff curve is simply the clearest way to answer them. Whether you are trading a single Nifty call option or a complex four-leg iron condor, looking at the payoff curve before you enter is one of the most valuable habits you can build as a trader.
The next time you are about to place a trade, take one moment to look at its payoff curve first. Know your risk. Know your break-even. Know your upside. Then decide. That small habit is what separates informed trading from guesswork — and it is available to every retail trader in India today.
Frequently Asked Questions (FAQs)
Do I need to calculate a payoff curve manually?
No. Platforms like uTrade Algos generate payoff curves automatically the moment you select or build a strategy. For simple strategies, you can calculate P&L manually using basic formulas — but for multi-leg strategies, the curve is far more practical and is generated instantly on the platform.
Are payoff curves useful for beginners in trading?
Yes, payoff curves are extremely useful for beginners because they simplify complex trading concepts. Instead of dealing with formulas or difficult calculations, beginners can visually understand how a trade behaves. This helps them learn risk management, avoid emotional decisions, and build confidence in trading.
Can payoff curves be used in options trading?
Yes, payoff curves are especially important in options trading because option strategies have non-linear profit and loss structures. Strategies like buying options, spreads, or iron condors can behave very differently based on market movement. Payoff curves clearly show these outcomes, making options trading easier to understand and manage.
What does the break-even point on a payoff curve mean?
The break-even point is where the payoff curve crosses the zero line — the price at which your total P&L is exactly ₹0. Below this, you are in a loss. Above it, you are in profit. For a long call, it is the strike price plus the premium paid.
What is the difference between a payoff curve and a profit and loss chart?
A payoff curve and a profit and loss (P&L) chart are closely related, but the key difference is usage. A payoff curve is typically used before entering a trade to analyze possible outcomes, while a P&L chart is used after or during a trade to track actual performance. Payoff curves are more predictive, whereas P&L charts are more real-time or historical.
.avif)
.avif)



.svg)





