
.avif)
Introduction
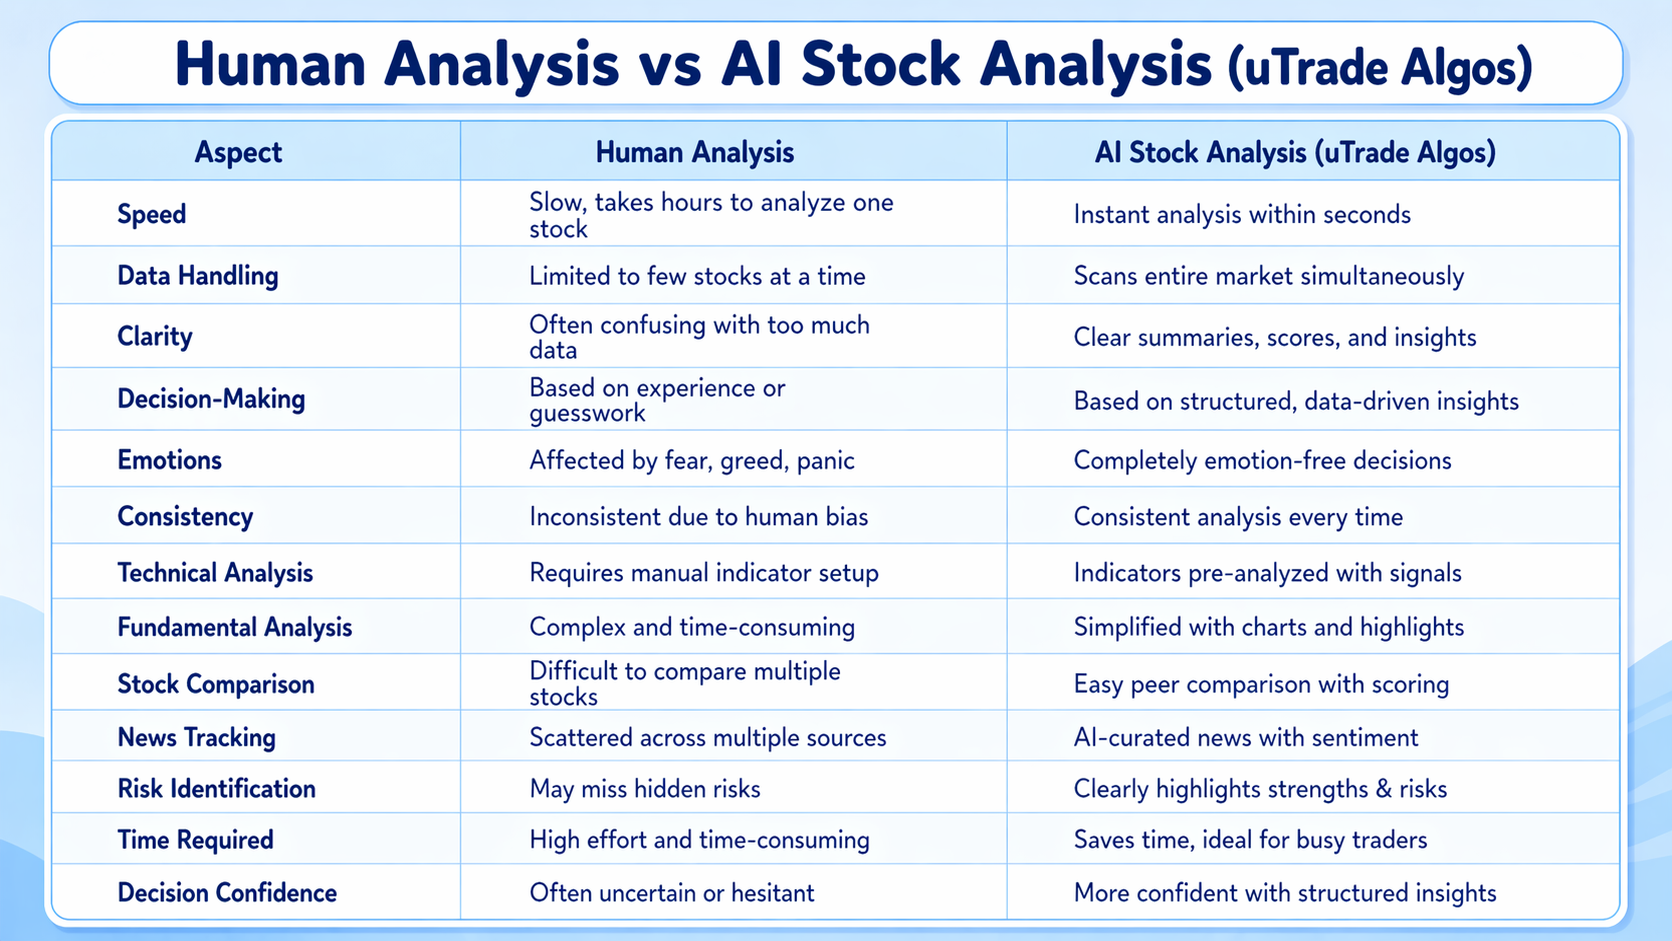
AI Stock Analysis through platforms like uTrade Algos helps retail traders make faster, clearer, and more informed decisions by turning complex data into simple, actionable insights.
You have heard it a hundred times — do your research before you invest. But what does that actually mean when you are a retail trader juggling work, family, and a trading terminal open in a browser tab? Most traders skip research not because they do not want to do it, but because it is time-consuming, confusing, and scattered across ten different websites.
That is exactly the problem AI stock analysis solves — and platforms like uTrade Algos are making it available to every retail trader in India through one clean, intelligent dashboard. In simple terms: instead of spending hours reading balance sheets and interpreting charts, AI does the heavy lifting and hands you the insight in seconds.
Let us break down exactly how this works — and why it matters for your trading decisions.
What is AI Stock Analysis?
AI stock analysis is the use of artificial intelligence to automatically evaluate a stock across multiple dimensions — price trends, financial health, valuation, sentiment, and momentum — and present the findings in a format that is easy to understand and act on.
Earlier, stock analysis meant:
- Reading balance sheets
- Studying charts manually
- Tracking news from multiple sources
Now, AI Stock Analysis does all of this in seconds.
But more importantly, it organizes it in a way you can actually understand.
Platforms like uTrade Algos bring this together into one dashboard where you can see:
- Stock summary
- Financial health
- Technical signals
- Market events
All without switching between apps or tools.
The best AI tools for stock market analysis in India do not just throw data at you. They organise it, score it, highlight what matters, and flag what needs attention. That is exactly what uTrade Algos has built into its AI Stock Analysis feature.
How AI Stock Analysis Helps Retail Traders Make Decisions
- AI gives you a complete stock summary in seconds, so you don’t waste time.
- AI Overview tells you whether a stock is strong or weak instantly.
- The overall score helps you decide “Is this stock worth looking at or not?”
- Factor Metrics shows clear strengths and risks without confusion.
- You don’t need deep knowledge—AI converts data into simple scores.
- Fundamentals become easy with visual charts instead of complex numbers.
- AI highlights financial trends automatically (growth or decline).
- Technicals show bullish or bearish signals without manual analysis.
- Indicators like RSI and MACD are already interpreted for you.
- Support & resistance levels are pre-marked using pivot levels.
- Volume analysis tells you whether traders or investors are active.
- Events & News keep you updated without checking multiple sources.
- AI filters important news with positive/negative sentiment.
- You avoid random tips because data is structured and verified.
- You can analyze multiple stocks in minutes instead of hours.
- AI reduces confusion by putting everything in one dashboard.
- You stop guessing and start making logic-based decisions.
- Helps you avoid emotional trading by giving clear direction.
- Perfect for busy people who get limited time during market hours.
- You focus only on high-quality opportunities, not everything.
Inside uTrade Algos' AI Stock Analysis: What It Actually Does
uTrade Algos breaks its AI stock analysis into five focused sections. Each one solves a specific problem that retail traders face when evaluating a stock.
1. AI Overview — Understand Any Stock in Seconds
The AI Overview gives you a quick and complete summary of any stock in just a few seconds. Instead of going through long reports and multiple sources, everything is presented in one place in a simple and easy-to-understand format.
What You Get:
- Quick Insight Cards
Easy-to-read cards that highlight important changes in price, ownership, and valuation - Overall Stock Score
A combined score based on multiple factors, helping you instantly understand whether the stock looks strong or weak - Historical Performance Range
Shows how the stock has performed in the past, so you know where it stands compared to its own history - SWOT Analysis
A simple breakdown of strengths, weaknesses, opportunities, and threats — generated automatically - Key Events & Triggers
Important events that have impacted or may impact the stock
Why It Matters:
Think of it like having a personal research assistant who gives you a short, clear brief before you make a decision — saving you hours of research and effort.
2. Factor Metrics — Know Exactly What You Are Buying
One of the biggest mistakes retail traders make is buying a stock based only on tips or news, without understanding its fundamentals. Factor Metrics helps solve this problem by giving you a clear breakdown of what you’re actually investing in.
What You Get:
- Performance Score
Shows how the stock has performed compared to expectations - Valuation Score
Helps you understand whether the stock is fairly priced, overpriced, or undervalued - Quality Score
Tells you how strong the company is from a business and financial point of view - Volatility Score
Shows how much the stock price moves or fluctuates - Sentiment Score
Reflects the overall market mood or opinion about the stock - Detailed Comparisons
Includes ratio analysis, sector benchmarks, and peer comparison tables so you can see how the stock compares with similar companies
Why It Matters:
You don’t have to guess anymore. Everything is explained clearly with simple scores and comparisons. What used to need expensive tools like a Bloomberg terminal or a full research team is now available instantly through AI.
3. Fundamentals — Financial Health Without the Spreadsheet Headache
Understanding a company’s financials is important, but for most retail traders, reading balance sheets and reports can feel confusing and time-consuming. The Fundamentals section on uTrade Algos makes this simple and easy to understand.
What You Get:
- Visual Financial Data
Earnings, revenue, expenses, assets, liabilities, and cash flow — all shown in simple charts that you can view quarterly or yearly - AI-Highlighted Trends
The system automatically points out important changes and patterns, so you don’t have to search for them yourself - Shareholding Pattern
Clear breakdown of who owns the stock — promoters, institutions, and retail investors — along with how their holdings change over time
Why It Matters:
These ownership changes are very important. If promoters keep increasing their stake, it usually shows confidence in the company. If institutional investors reduce their holdings suddenly, it can be a warning sign. AI tracks all these changes and presents them clearly, helping you make better decisions without digging through complex data.
4. Technicals — Charts and Signals Without the Confusion
For traders who use price action and technical indicators, this section works like a complete toolkit. The Technicals section makes it easier to understand charts and signals without getting confused.
What You Get:
- SMA & EMA Trends
Tracks moving averages across different timeframes, with AI clearly showing whether the trend is bullish or bearish - Key Indicators with Explanation
Includes RSI, MACD, ADX, MFI, ATR, and ROC — along with simple interpretations, not just numbers - Pivot Levels
Shows important support and resistance levels to help you plan entry and exit points - Volume Analysis
Compares total traded volume with delivery volume to understand whether activity is from short-term traders or long-term investors
Why It Matters:
"The trend is your friend until the end when it bends." — Ed Seykota
This famous trading idea is true, but spotting the trend — and knowing when it is changing — is where most traders struggle. AI-powered technical analysis helps by identifying these shifts early, reducing guesswork and helping you make more confident trading decisions.
5. Events & News — Never Miss What Moves a Stock
A single company update can move a stock by 5–10% in one session. Things like dividends, board meetings, stock splits, or rating changes can have a big impact — and missing them can cost you money. The Events & News section on uTrade Algos brings all this important information into one place.
What You Get:
- Corporate Actions
Details of dividends, bonuses, stock splits, and board meetings — all with clear dates - AI-Curated News
Important news, analyst updates, and company announcements — filtered to show only what really matters - Sentiment Tags
Each news item is marked as positive, negative, or neutral, so you can quickly understand market sentiment - Source & Timestamp
Every update includes its source and time, so you can easily verify the information
Why It Matters:
This is especially helpful for traders who cannot track news all day. AI filters out the noise and shows you only the most relevant updates, helping you stay informed and make better decisions quickly.
A Real-Life Scenario: How Priya Uses AI Stock Analysis
Priya is a 29-year-old marketing professional from Bengaluru. She invests in equities but has maybe 20 minutes in the evening to look at her portfolio. She has no time to read quarterly results, track promoter activity, and monitor technical charts — all for each stock she is considering.
With uTrade Algos' AI stock analysis, here is what her 20 minutes now looks like:
She opens the AI Overview for a stock she has been watching —
she gets the score, the SWOT, and the key events at a glance.
She checks Factor Metrics to see how it rates on valuation and quality.
She glances at Fundamentals to confirm revenue is growing.
She checks the Technicals section — RSI, MACD signals — to see if the timing looks right. Then she checks Events to make sure there is nothing coming up (like an earnings date or a promoter sell-off) that would change the picture.
Total time? About 15 minutes, for a research process that used to take hours. And because AI is applying the same logic every time, her analysis is consistent, not dependent on how tired or distracted she happens to be that day.
That is the real value of AI stock analysis — not just speed, but consistency and discipline.
Conclusion
AI stock analysis is not about removing the trader from the decision. It is about making sure the trader is making decisions with full, accurate, and well-organised information — not gut feelings or half-read articles.
uTrade Algos has built exactly this — a structured, AI-powered stock analysis tool that covers every angle: the big-picture overview, factor scoring, fundamentals, technical signals, and real-time events. Whether you are a beginner who does not know where to start or an experienced trader who wants faster, deeper research, the platform brings institutional-quality analysis to your screen.
If you are ready to stop guessing and start investing with actual intelligence behind your decisions, explore uTrade Algos' AI Stock Analysis — free trial available.
Frequently Asked Questions (FAQs)
Can AI predict stock market movements accurately?
No. AI identifies patterns and probabilities — but markets are unpredictable. Use it for better analysis, not guaranteed predictions.
Is AI-based trading legal in India?
Yes. AI-assisted analysis is fully legal. Algo trading is also legal but regulated by SEBI — you must use a SEBI-registered broker.
Do I need coding knowledge to use AI stock analysis tools?
No. Most platforms including uTrade Algos are no-code — you get AI-powered insights without writing a single line of code.
What is the difference between AI stock analysis and a regular stock screener?
A screener filters stocks based on your inputs. AI analysis goes further — it scores, interprets, flags patterns, and explains the reasoning automatically.
Can AI analyse both fundamentals and technicals together?
Yes. Tools like uTrade Algos' AI Stock Analysis cover earnings, ratios, shareholding (fundamentals) AND RSI, MACD, pivot levels (technicals) — all in one dashboard.
How accurate is AI in reading technical indicators like RSI and MACD?
AI reads them consistently and without bias. It flags bullish or bearish signals based on historical pattern logic — accuracy depends on market conditions, not emotion.
Is AI stock analysis useful for intraday traders or only long-term investors?
Both. Technicals and volume analysis help intraday traders; fundamentals and factor scoring help long-term investors.
What does shareholding pattern analysis tell me about a stock?
It shows who owns the stock — promoters, institutions, retail — and whether stakes are rising or falling. A drop in promoter holding can be an early warning sign.
Can I use AI tools for stock analysis on mobile in India?
Yes. Most modern platforms offer mobile-friendly dashboards so you can analyse stocks on the go. uTrade Algos provides a mobile app for both Android and Apple devices.
.avif)
.avif)

.avif)
.avif)
.avif)
.avif)

.svg)





